| Param | Original file | Final file |
|---|---|---|
| Filename | modeM0/AS1A11_007T07_9000004758cztM0_level2_bc.evt | modeM0/AS1A11_007T07_9000004758cztM0_level2_quad_clean.evt |
| Size (bytes) | 4,690,278,720 | 738,360,000 |
| Size | 4.4 GB | 704.2 MB |
| Events in quadrant A | 12,343,943 | 5,224,692 |
| Events in quadrant B | 20,516,909 | 4,949,917 |
| Events in quadrant C | 22,883,560 | 5,017,853 |
| Events in quadrant D | 82,298,776 | 3,113,918 |
| Mode SS | |||
|---|---|---|---|
| Quadrant | BADHDUFLAG | Total packets | Discarded packets |
| A | 0 | 1202 | 0 |
| B | 0 | 1202 | 0 |
| C | 0 | 1202 | 0 |
| D | 0 | 1202 | 0 |
| Mode M0 | |||
|---|---|---|---|
| Quadrant | BADHDUFLAG | Total packets | Discarded packets |
| A | 0 | 119548 | 0 |
| B | 0 | 156935 | 0 |
| C | 0 | 162397 | 0 |
| D | 0 | 349158 | 0 |
| Mode M9 | |||
|---|---|---|---|
| Quadrant | BADHDUFLAG | Total packets | Discarded packets |
| A | 0 | 226 | 0 |
| B | 0 | 226 | 0 |
| C | 0 | 226 | 0 |
| D | 0 | 226 | 0 |
| Quadrant | Total seconds | Saturated seconds | Saturation percentage |
|---|---|---|---|
| A | 58975 | 53 | 0.089869% |
| B | 58975 | 3942 | 6.684188% |
| C | 58975 | 3360 | 5.697329% |
| D | 58975 | 28187 | 47.794828% |
Noise dominated data is calculated using 1-second bins in cleaned event files. If a bin has >2000 counts, and if more than 50% of those come from <1% of pixels, then it is considered to be noise-dominated and hence unusable.
| Quadrant | # 1 sec bins | Bins with >0 counts | Bins with >2000 counts | High rate bins dominated by noise | Noise dominated (total time) | Noise dominated (detector-on time) | Marked lightcurve |
|---|---|---|---|---|---|---|---|
| A | 81441 | 58975 | 0 | 0 | 0.00% | 0.00% | 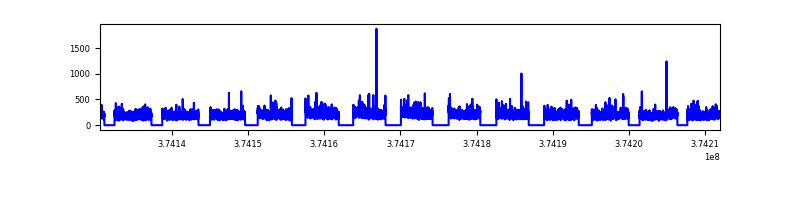 |
| B | 81441 | 58973 | 216 | 216 | 0.27% | 0.37% |  |
| C | 81441 | 58977 | 293 | 293 | 0.36% | 0.50% | 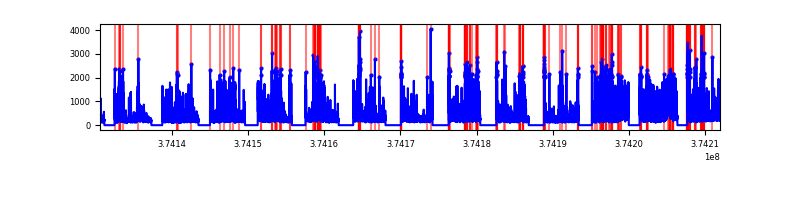 |
| D | 81441 | 58972 | 18981 | 18981 | 23.31% | 32.19% |  |
Top three noisy pixels from each quadrant. If the there are fewer than three noisy pixels in the level2.evt file, extra rows are filled as -1
| Pixel properties | Quadrant properties | ||||||
|---|---|---|---|---|---|---|---|
| Quadrant | DetID | PixID | Counts | Sigma | Mean | Median | Sigma |
| A | 13 | 254 | 116290 | 165.43 | 3129 | 3081 | 684.3 |
| A | 15 | 169 | 61362 | 85.17 | 3129 | 3081 | 684.3 |
| A | 13 | 6 | 49137 | 67.3 | 3129 | 3081 | 684.3 |
| B | 5 | 172 | 5440579 | 9049.41 | 3025 | 2957 | 600.9 |
| B | 5 | 200 | 1000627 | 1660.34 | 3025 | 2957 | 600.9 |
| B | 0 | 189 | 623719 | 1033.09 | 3025 | 2957 | 600.9 |
| C | 8 | 111 | 6195502 | 9092.84 | 2983 | 2968 | 681.0 |
| C | 7 | 221 | 1772397 | 2598.15 | 2983 | 2968 | 681.0 |
| C | 0 | 10 | 1095425 | 1604.12 | 2983 | 2968 | 681.0 |
| D | 7 | 223 | 49884882 | 79024.21 | 2333 | 2288 | 631.2 |
| D | 12 | 218 | 9637525 | 15264.18 | 2333 | 2288 | 631.2 |
| D | 8 | 195 | 7179502 | 11370.17 | 2333 | 2288 | 631.2 |
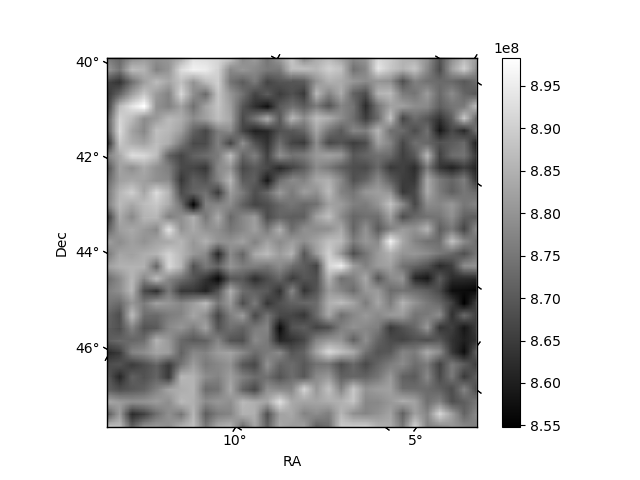
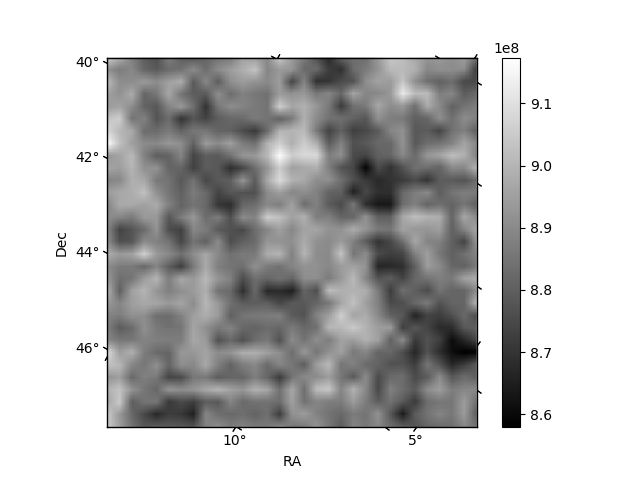
Histogram calculated using DETX and DETY for each event in the final _common_clean file
| Quadrant A |  |
 |
Quadrant B |
|---|---|---|---|
| Quadrant D |  |
 |
Quadrant C |
| Plot type | Count rate plots | Images |
|---|---|---|
| Comparison with Poisson distribution Blue bars denote a histogram of data divided into 1 sec bins. Red curve is a Poisson curve with rate = median count rate of data. |
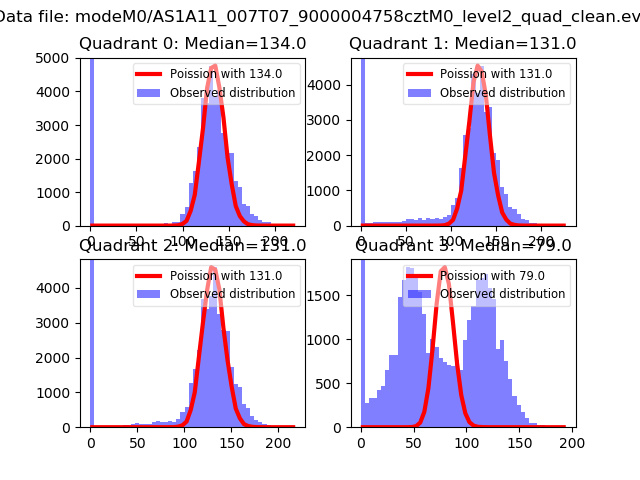 |
 |
| Quadrant-wise count rates Data is divided into 100 sec bins |
 |
|
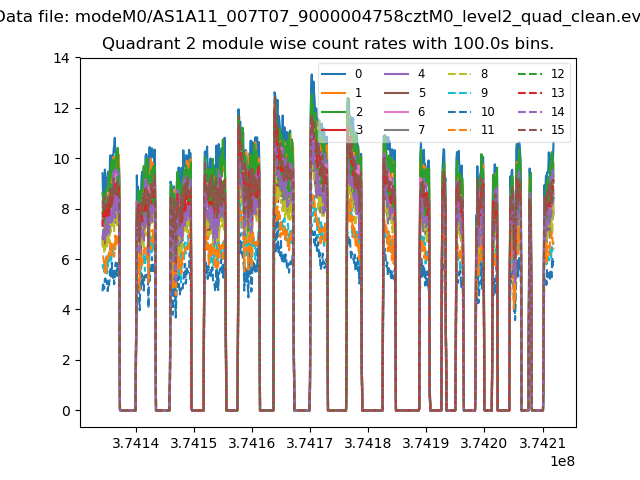
| Module-wise count rates for Quadrant A Data is divided into 100 sec bins |
 |
 |
| Module-wise count rates for Quadrant B Data is divided into 100 sec bins |
 |
 |
| Module-wise count rates for Quadrant C Data is divided into 100 sec bins |
 |
 |
| Module-wise count rates for Quadrant D Data is divided into 100 sec bins |
 |
 |
| Parameter | Plot |
|---|---|
| CZT HV Monitor |  |
| D_VDD |  |
| Temperature 1 |  |
| Veto HV Monitor |  |
| Veto LLD | 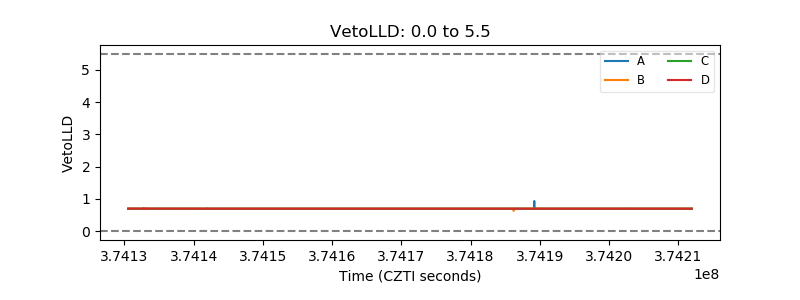 |
| Alpha Counter | 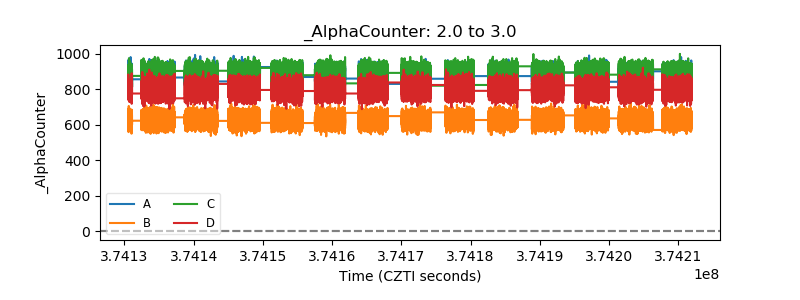 |
| _CPM_Rate |  |
| CZT Counter |  |
| +2.5 Volts monitor |  |
| +5 Volts monitor |  |
| _ROLL_ROT |  |
| _Roll_DEC |  |
| _Roll_RA |  |
| Veto Counter |  |