| Param | Original file | Final file |
|---|---|---|
| Filename | modeM0/AS1T04_065T01_9000004750cztM0_level2_bc.evt | modeM0/AS1T04_065T01_9000004750cztM0_level2_quad_clean.evt |
| Size (bytes) | 761,405,760 | 170,631,360 |
| Size | 726.1 MB | 162.7 MB |
| Events in quadrant A | 1,998,404 | 1,221,170 |
| Events in quadrant B | 3,627,008 | 1,206,335 |
| Events in quadrant C | 2,132,550 | 1,234,696 |
| Events in quadrant D | 14,624,585 | 820,210 |
| Mode M0 | |||
|---|---|---|---|
| Quadrant | BADHDUFLAG | Total packets | Discarded packets |
| A | 0 | 19921 | 0 |
| B | 0 | 27605 | 0 |
| C | 0 | 20253 | 0 |
| D | 0 | 60904 | 0 |
| Mode SS | |||
|---|---|---|---|
| Quadrant | BADHDUFLAG | Total packets | Discarded packets |
| A | 0 | 202 | 0 |
| B | 0 | 202 | 0 |
| C | 0 | 202 | 0 |
| D | 0 | 202 | 0 |
| Mode M9 | |||
|---|---|---|---|
| Quadrant | BADHDUFLAG | Total packets | Discarded packets |
| A | 0 | 15 | 0 |
| B | 0 | 15 | 0 |
| C | 0 | 15 | 0 |
| D | 0 | 15 | 0 |
| Quadrant | Total seconds | Saturated seconds | Saturation percentage |
|---|---|---|---|
| A | 9855 | 12 | 0.121766% |
| B | 9855 | 879 | 8.919330% |
| C | 9855 | 20 | 0.202943% |
| D | 9855 | 5068 | 51.425672% |
Noise dominated data is calculated using 1-second bins in cleaned event files. If a bin has >2000 counts, and if more than 50% of those come from <1% of pixels, then it is considered to be noise-dominated and hence unusable.
| Quadrant | # 1 sec bins | Bins with >0 counts | Bins with >2000 counts | High rate bins dominated by noise | Noise dominated (total time) | Noise dominated (detector-on time) | Marked lightcurve |
|---|---|---|---|---|---|---|---|
| A | 11228 | 9854 | 0 | 0 | 0.00% | 0.00% |  |
| B | 11228 | 9854 | 24 | 24 | 0.21% | 0.24% |  |
| C | 11228 | 9854 | 3 | 3 | 0.03% | 0.03% |  |
| D | 11228 | 9852 | 2893 | 2893 | 25.77% | 29.36% |  |
Top three noisy pixels from each quadrant. If the there are fewer than three noisy pixels in the level2.evt file, extra rows are filled as -1
| Pixel properties | Quadrant properties | ||||||
|---|---|---|---|---|---|---|---|
| Quadrant | DetID | PixID | Counts | Sigma | Mean | Median | Sigma |
| A | 0 | 191 | 41050 | 366.14 | 489 | 480 | 110.8 |
| A | 14 | 238 | 19495 | 171.61 | 489 | 480 | 110.8 |
| A | 13 | 254 | 17949 | 157.66 | 489 | 480 | 110.8 |
| B | 5 | 172 | 1424267 | 14341.98 | 481 | 471 | 99.3 |
| B | 15 | 54 | 51420 | 513.21 | 481 | 471 | 99.3 |
| B | 5 | 200 | 45862 | 457.23 | 481 | 471 | 99.3 |
| C | 0 | 10 | 66747 | 576.74 | 486 | 480 | 114.9 |
| C | 1 | 241 | 42859 | 368.84 | 486 | 480 | 114.9 |
| C | 3 | 233 | 30874 | 264.53 | 486 | 480 | 114.9 |
| D | 12 | 227 | 8839726 | 91858.32 | 357 | 347 | 96.2 |
| D | 8 | 195 | 1736300 | 18039.92 | 357 | 347 | 96.2 |
| D | 7 | 80 | 720447 | 7483.24 | 357 | 347 | 96.2 |
Histogram calculated using DETX and DETY for each event in the final _common_clean file
| Quadrant A |  |
 |
Quadrant B |
|---|---|---|---|
| Quadrant D |  |
 |
Quadrant C |
| Plot type | Count rate plots | Images |
|---|---|---|
| Comparison with Poisson distribution Blue bars denote a histogram of data divided into 1 sec bins. Red curve is a Poisson curve with rate = median count rate of data. |
 |
 |
| Quadrant-wise count rates Data is divided into 100 sec bins |
 |
|
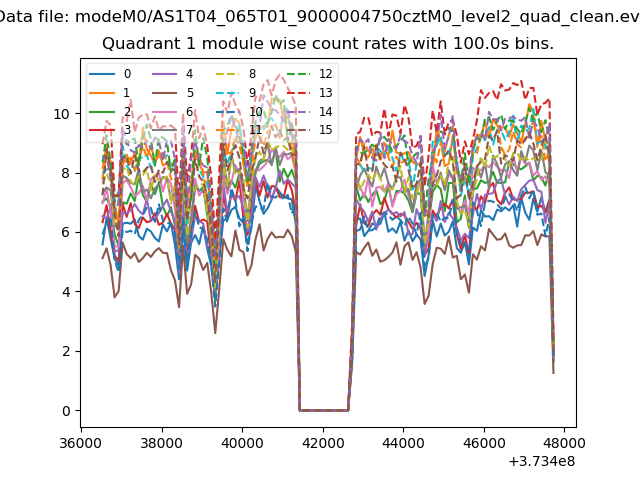
| Module-wise count rates for Quadrant A Data is divided into 100 sec bins |
 |
 |
| Module-wise count rates for Quadrant B Data is divided into 100 sec bins |
 |
 |
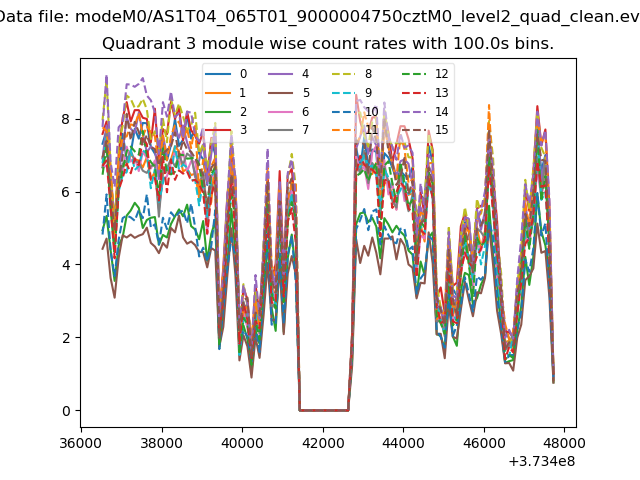
| Module-wise count rates for Quadrant C Data is divided into 100 sec bins |
 |
 |
| Module-wise count rates for Quadrant D Data is divided into 100 sec bins |
 |
 |
| Parameter | Plot |
|---|---|
| CZT HV Monitor |  |
| D_VDD |  |
| Temperature 1 |  |
| Veto HV Monitor |  |
| Veto LLD | 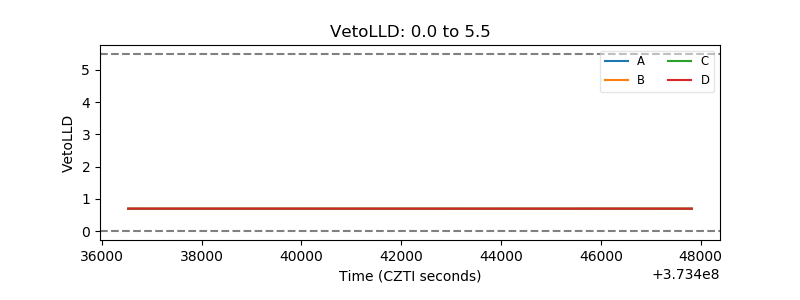 |
| Alpha Counter |  |
| _CPM_Rate |  |
| CZT Counter |  |
| +2.5 Volts monitor |  |
| +5 Volts monitor |  |
| _ROLL_ROT |  |
| _Roll_DEC |  |
| _Roll_RA |  |
| Veto Counter |  |