| Param | Original file | Final file |
|---|---|---|
| Filename | modeM0/AS1C07_001T01_9000004752cztM0_level2_bc.evt | modeM0/AS1C07_001T01_9000004752cztM0_level2_quad_clean.evt |
| Size (bytes) | 4,237,519,680 | 1,308,579,840 |
| Size | 3.9 GB | 1.2 GB |
| Events in quadrant A | 14,683,172 | 9,060,917 |
| Events in quadrant B | 27,931,305 | 8,717,488 |
| Events in quadrant C | 18,649,403 | 9,072,873 |
| Events in quadrant D | 62,279,289 | 7,943,401 |
| Mode M0 | |||
|---|---|---|---|
| Quadrant | BADHDUFLAG | Total packets | Discarded packets |
| A | 0 | 142993 | 0 |
| B | 0 | 202749 | 0 |
| C | 0 | 155466 | 0 |
| D | 0 | 304242 | 0 |
| Mode SS | |||
|---|---|---|---|
| Quadrant | BADHDUFLAG | Total packets | Discarded packets |
| A | 0 | 1438 | 0 |
| B | 0 | 1438 | 0 |
| C | 0 | 1438 | 0 |
| D | 0 | 1438 | 0 |
| Mode M9 | |||
|---|---|---|---|
| Quadrant | BADHDUFLAG | Total packets | Discarded packets |
| A | 0 | 262 | 0 |
| B | 0 | 262 | 0 |
| C | 0 | 262 | 0 |
| D | 0 | 262 | 0 |
| Quadrant | Total seconds | Saturated seconds | Saturation percentage |
|---|---|---|---|
| A | 70589 | 99 | 0.140248% |
| B | 70589 | 6805 | 9.640312% |
| C | 70589 | 920 | 1.303319% |
| D | 70589 | 9358 | 13.257023% |
Noise dominated data is calculated using 1-second bins in cleaned event files. If a bin has >2000 counts, and if more than 50% of those come from <1% of pixels, then it is considered to be noise-dominated and hence unusable.
| Quadrant | # 1 sec bins | Bins with >0 counts | Bins with >2000 counts | High rate bins dominated by noise | Noise dominated (total time) | Noise dominated (detector-on time) | Marked lightcurve |
|---|---|---|---|---|---|---|---|
| A | 95856 | 70589 | 4 | 4 | 0.00% | 0.01% |  |
| B | 95855 | 70573 | 605 | 605 | 0.63% | 0.86% | 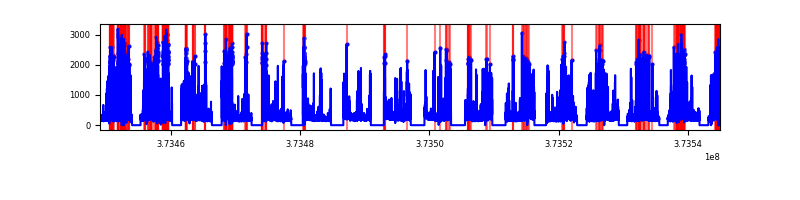 |
| C | 95856 | 70587 | 193 | 193 | 0.20% | 0.27% |  |
| D | 95856 | 70581 | 2662 | 2662 | 2.78% | 3.77% |  |
Top three noisy pixels from each quadrant. If the there are fewer than three noisy pixels in the level2.evt file, extra rows are filled as -1
| Pixel properties | Quadrant properties | ||||||
|---|---|---|---|---|---|---|---|
| Quadrant | DetID | PixID | Counts | Sigma | Mean | Median | Sigma |
| A | 13 | 6 | 137151 | 168.65 | 3627 | 3579 | 792.0 |
| A | 13 | 254 | 124746 | 152.98 | 3627 | 3579 | 792.0 |
| A | 0 | 191 | 112971 | 138.12 | 3627 | 3579 | 792.0 |
| B | 5 | 172 | 8660350 | 12496.11 | 3500 | 3426 | 692.8 |
| B | 5 | 200 | 2568278 | 3702.32 | 3500 | 3426 | 692.8 |
| B | 0 | 219 | 915338 | 1316.33 | 3500 | 3426 | 692.8 |
| C | 9 | 54 | 1469562 | 1765.33 | 3581 | 3554 | 830.4 |
| C | 0 | 10 | 1454833 | 1747.6 | 3581 | 3554 | 830.4 |
| C | 1 | 241 | 811180 | 972.52 | 3581 | 3554 | 830.4 |
| D | 8 | 195 | 19105414 | 21370.26 | 3350 | 3279 | 893.9 |
| D | 12 | 227 | 6686844 | 7477.15 | 3350 | 3279 | 893.9 |
| D | 7 | 80 | 4843388 | 5414.81 | 3350 | 3279 | 893.9 |
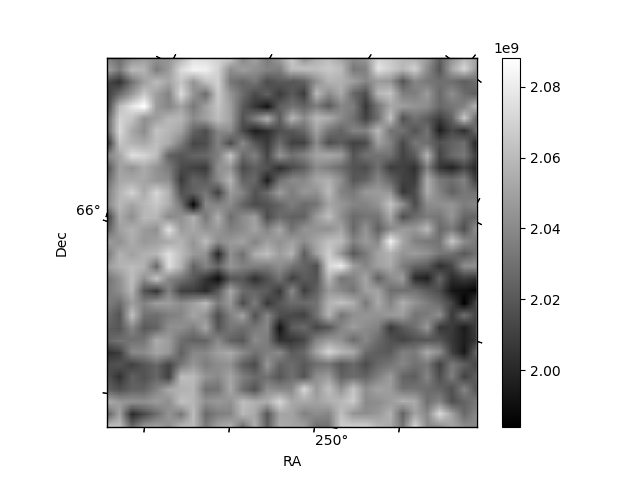
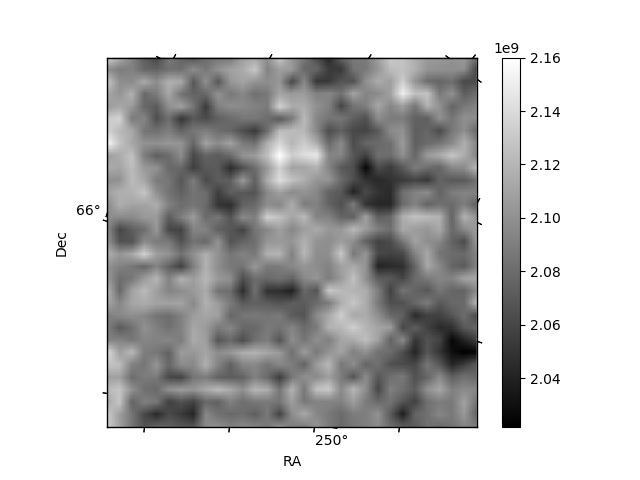
Histogram calculated using DETX and DETY for each event in the final _common_clean file
| Quadrant A |  |
 |
Quadrant B |
|---|---|---|---|
| Quadrant D |  |
 |
Quadrant C |
| Plot type | Count rate plots | Images |
|---|---|---|
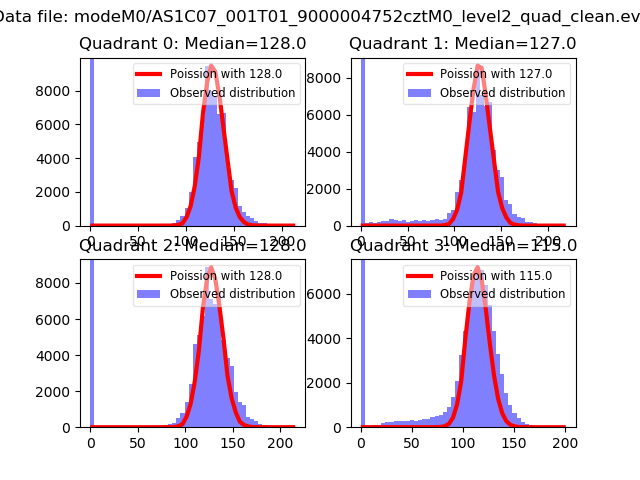
| Comparison with Poisson distribution Blue bars denote a histogram of data divided into 1 sec bins. Red curve is a Poisson curve with rate = median count rate of data. |
 |
 |
| Quadrant-wise count rates Data is divided into 100 sec bins |
 |
|
| Module-wise count rates for Quadrant A Data is divided into 100 sec bins |
 |
 |
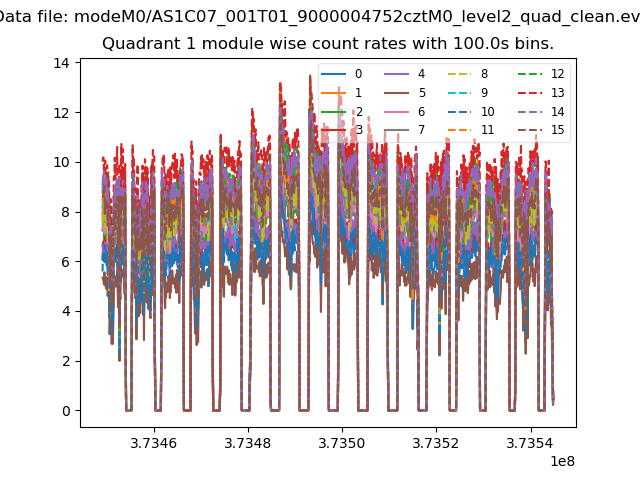
| Module-wise count rates for Quadrant B Data is divided into 100 sec bins |
 |
 |
| Module-wise count rates for Quadrant C Data is divided into 100 sec bins |
 |
 |
| Module-wise count rates for Quadrant D Data is divided into 100 sec bins |
 |
 |
| Parameter | Plot |
|---|---|
| CZT HV Monitor |  |
| D_VDD |  |
| Temperature 1 |  |
| Veto HV Monitor |  |
| Veto LLD |  |
| Alpha Counter |  |
| _CPM_Rate |  |
| CZT Counter |  |
| +2.5 Volts monitor |  |
| +5 Volts monitor | 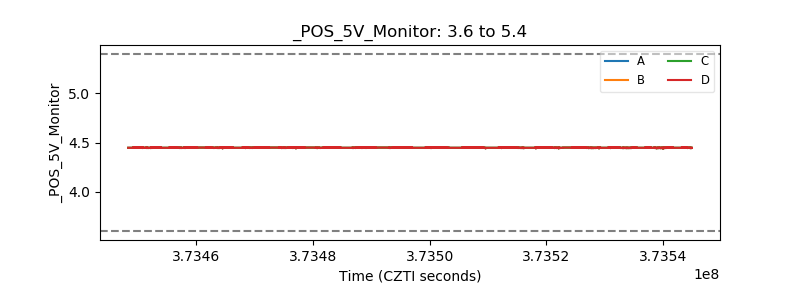 |
| _ROLL_ROT |  |
| _Roll_DEC |  |
| _Roll_RA |  |
| Veto Counter |  |