| Param | Original file | Final file |
|---|---|---|
| Filename | modeM0/AS1C07_005T01_9000004748cztM0_level2_bc.evt | modeM0/AS1C07_005T01_9000004748cztM0_level2_quad_clean.evt |
| Size (bytes) | 11,883,225,600 | 3,639,876,480 |
| Size | 11.1 GB | 3.4 GB |
| Events in quadrant A | 42,785,369 | 25,057,005 |
| Events in quadrant B | 69,480,796 | 24,804,436 |
| Events in quadrant C | 50,233,228 | 25,176,399 |
| Events in quadrant D | 184,122,404 | 21,805,744 |
| Mode SS | |||
|---|---|---|---|
| Quadrant | BADHDUFLAG | Total packets | Discarded packets |
| A | 0 | 4000 | 0 |
| B | 0 | 4000 | 0 |
| C | 0 | 4000 | 0 |
| D | 0 | 4000 | 0 |
| Mode M9 | |||
|---|---|---|---|
| Quadrant | BADHDUFLAG | Total packets | Discarded packets |
| A | 0 | 747 | 0 |
| B | 0 | 747 | 0 |
| C | 0 | 747 | 0 |
| D | 0 | 747 | 0 |
| Mode M0 | |||
|---|---|---|---|
| Quadrant | BADHDUFLAG | Total packets | Discarded packets |
| A | 0 | 400126 | 0 |
| B | 0 | 517895 | 0 |
| C | 0 | 422332 | 0 |
| D | 0 | 877111 | 0 |
| Quadrant | Total seconds | Saturated seconds | Saturation percentage |
|---|---|---|---|
| A | 195694 | 430 | 0.219731% |
| B | 195694 | 11750 | 6.004272% |
| C | 195694 | 2014 | 1.029158% |
| D | 195694 | 30448 | 15.558985% |
Noise dominated data is calculated using 1-second bins in cleaned event files. If a bin has >2000 counts, and if more than 50% of those come from <1% of pixels, then it is considered to be noise-dominated and hence unusable.
| Quadrant | # 1 sec bins | Bins with >0 counts | Bins with >2000 counts | High rate bins dominated by noise | Noise dominated (total time) | Noise dominated (detector-on time) | Marked lightcurve |
|---|---|---|---|---|---|---|---|
| A | 270383 | 195700 | 61 | 61 | 0.02% | 0.03% |  |
| B | 270383 | 195683 | 559 | 559 | 0.21% | 0.29% |  |
| C | 270383 | 195695 | 397 | 397 | 0.15% | 0.20% |  |
| D | 270383 | 195685 | 10167 | 10167 | 3.76% | 5.20% |  |
Top three noisy pixels from each quadrant. If the there are fewer than three noisy pixels in the level2.evt file, extra rows are filled as -1
| Pixel properties | Quadrant properties | ||||||
|---|---|---|---|---|---|---|---|
| Quadrant | DetID | PixID | Counts | Sigma | Mean | Median | Sigma |
| A | 14 | 63 | 564352 | 244.93 | 10242 | 10107 | 2262.8 |
| A | 0 | 143 | 459590 | 198.64 | 10242 | 10107 | 2262.8 |
| A | 13 | 254 | 356753 | 153.19 | 10242 | 10107 | 2262.8 |
| B | 5 | 172 | 16224691 | 8098.35 | 10149 | 9950 | 2002.2 |
| B | 5 | 200 | 2993424 | 1490.08 | 10149 | 9950 | 2002.2 |
| B | 0 | 219 | 2442425 | 1214.88 | 10149 | 9950 | 2002.2 |
| C | 0 | 10 | 4466175 | 1915.76 | 10104 | 10055 | 2326.0 |
| C | 14 | 67 | 2245212 | 960.93 | 10104 | 10055 | 2326.0 |
| C | 1 | 241 | 1199158 | 511.22 | 10104 | 10055 | 2326.0 |
| D | 8 | 195 | 77201877 | 31083.69 | 9390 | 9178 | 2483.4 |
| D | 12 | 227 | 22405504 | 9018.47 | 9390 | 9178 | 2483.4 |
| D | 7 | 80 | 10689809 | 4300.84 | 9390 | 9178 | 2483.4 |
Histogram calculated using DETX and DETY for each event in the final _common_clean file
| Quadrant A | 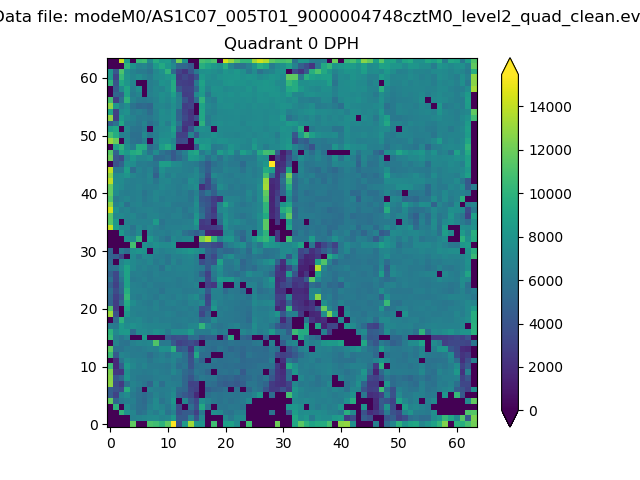 |
 |
Quadrant B |
|---|---|---|---|
| Quadrant D | 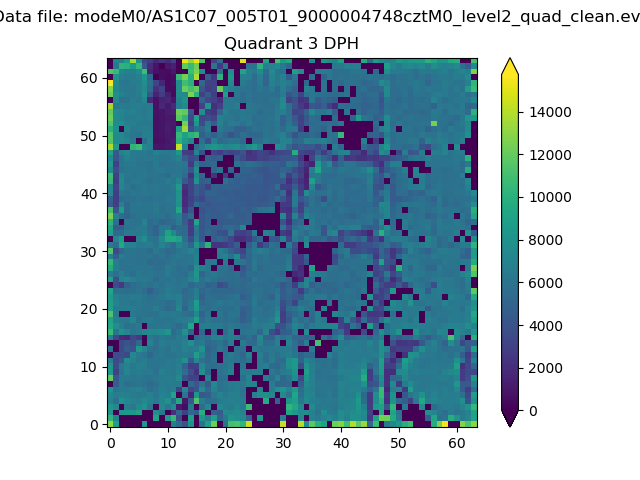 |
 |
Quadrant C |
| Plot type | Count rate plots | Images |
|---|---|---|
| Comparison with Poisson distribution Blue bars denote a histogram of data divided into 1 sec bins. Red curve is a Poisson curve with rate = median count rate of data. |
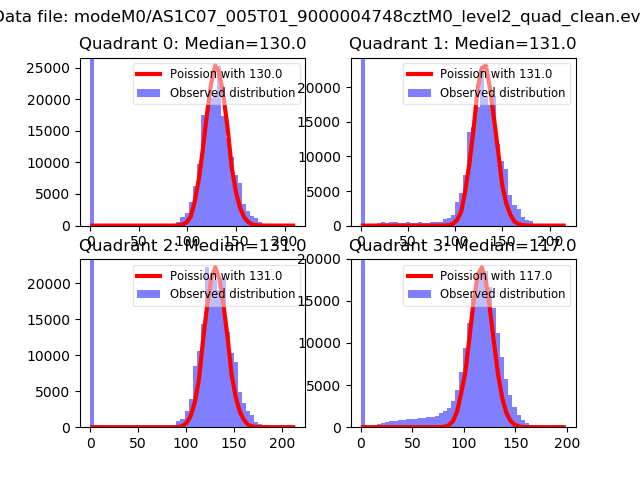 |
 |
| Quadrant-wise count rates Data is divided into 100 sec bins |
 |
|
| Module-wise count rates for Quadrant A Data is divided into 100 sec bins |
 |
 |
| Module-wise count rates for Quadrant B Data is divided into 100 sec bins |
 |
 |
| Module-wise count rates for Quadrant C Data is divided into 100 sec bins |
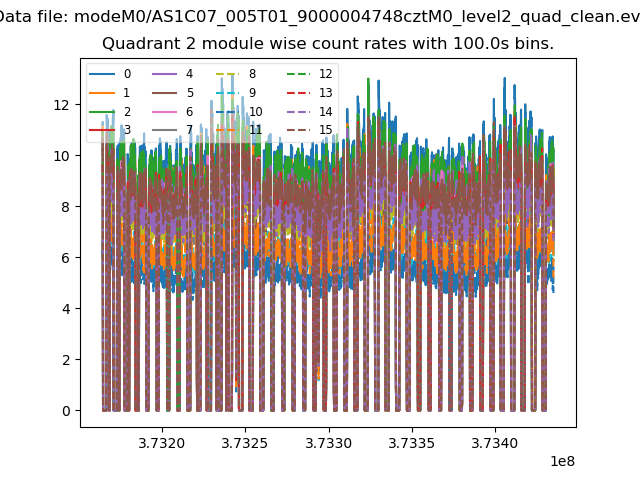 |
 |
| Module-wise count rates for Quadrant D Data is divided into 100 sec bins |
 |
 |
| Parameter | Plot |
|---|---|
| CZT HV Monitor |  |
| D_VDD |  |
| Temperature 1 |  |
| Veto HV Monitor |  |
| Veto LLD |  |
| Alpha Counter |  |
| _CPM_Rate |  |
| CZT Counter | 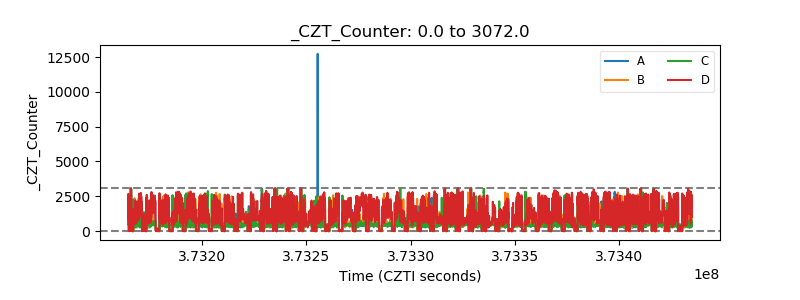 |
| +2.5 Volts monitor | 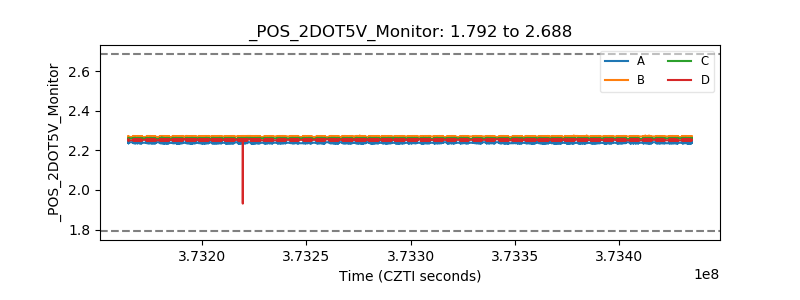 |
| +5 Volts monitor |  |
| _ROLL_ROT |  |
| _Roll_DEC |  |
| _Roll_RA |  |
| Veto Counter |  |