| Param | Original file | Final file |
|---|---|---|
| Filename | modeM0/AS1A11_007T06_9000004746cztM0_level2_bc.evt | modeM0/AS1A11_007T06_9000004746cztM0_level2_quad_clean.evt |
| Size (bytes) | 893,309,760 | 178,004,160 |
| Size | 851.9 MB | 169.8 MB |
| Events in quadrant A | 3,280,298 | 1,126,954 |
| Events in quadrant B | 4,269,448 | 1,143,347 |
| Events in quadrant C | 4,082,619 | 1,150,021 |
| Events in quadrant D | 14,444,088 | 981,312 |
| Mode SS | |||
|---|---|---|---|
| Quadrant | BADHDUFLAG | Total packets | Discarded packets |
| A | 0 | 292 | 0 |
| B | 0 | 292 | 0 |
| C | 0 | 292 | 0 |
| D | 0 | 292 | 0 |
| Mode M9 | |||
|---|---|---|---|
| Quadrant | BADHDUFLAG | Total packets | Discarded packets |
| A | 0 | 61 | 0 |
| B | 0 | 61 | 0 |
| C | 0 | 61 | 0 |
| D | 0 | 61 | 0 |
| Mode M0 | |||
|---|---|---|---|
| Quadrant | BADHDUFLAG | Total packets | Discarded packets |
| A | 0 | 29167 | 0 |
| B | 0 | 33581 | 0 |
| C | 0 | 31643 | 0 |
| D | 0 | 65492 | 0 |
| Quadrant | Total seconds | Saturated seconds | Saturation percentage |
|---|---|---|---|
| A | 14323 | 20 | 0.139636% |
| B | 14323 | 342 | 2.387768% |
| C | 14323 | 150 | 1.047267% |
| D | 14323 | 2054 | 14.340571% |
Noise dominated data is calculated using 1-second bins in cleaned event files. If a bin has >2000 counts, and if more than 50% of those come from <1% of pixels, then it is considered to be noise-dominated and hence unusable.
| Quadrant | # 1 sec bins | Bins with >0 counts | Bins with >2000 counts | High rate bins dominated by noise | Noise dominated (total time) | Noise dominated (detector-on time) | Marked lightcurve |
|---|---|---|---|---|---|---|---|
| A | 20392 | 14323 | 9 | 9 | 0.04% | 0.06% | 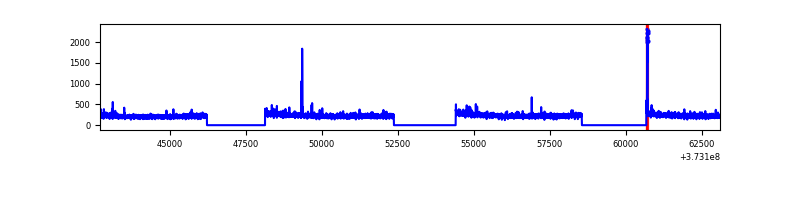 |
| B | 20392 | 14321 | 7 | 7 | 0.03% | 0.05% | 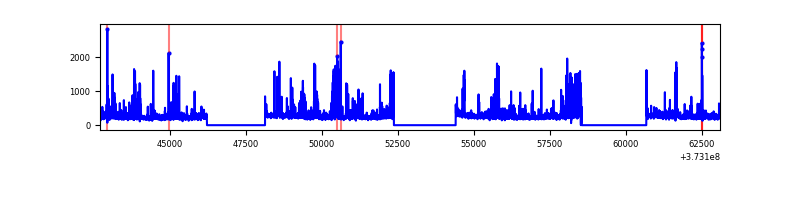 |
| C | 20392 | 14323 | 19 | 19 | 0.09% | 0.13% |  |
| D | 20392 | 14323 | 1104 | 1104 | 5.41% | 7.71% |  |
Top three noisy pixels from each quadrant. If the there are fewer than three noisy pixels in the level2.evt file, extra rows are filled as -1
| Pixel properties | Quadrant properties | ||||||
|---|---|---|---|---|---|---|---|
| Quadrant | DetID | PixID | Counts | Sigma | Mean | Median | Sigma |
| A | 9 | 143 | 44344 | 247.16 | 814 | 805 | 176.2 |
| A | 14 | 63 | 42712 | 237.89 | 814 | 805 | 176.2 |
| A | 13 | 254 | 26037 | 143.23 | 814 | 805 | 176.2 |
| B | 5 | 172 | 538083 | 3347.79 | 823 | 808 | 160.5 |
| B | 0 | 219 | 99738 | 616.44 | 823 | 808 | 160.5 |
| B | 0 | 197 | 97348 | 601.55 | 823 | 808 | 160.5 |
| C | 0 | 10 | 362765 | 1921.51 | 818 | 815 | 188.4 |
| C | 14 | 67 | 328864 | 1741.54 | 818 | 815 | 188.4 |
| C | 3 | 233 | 76814 | 403.46 | 818 | 815 | 188.4 |
| D | 12 | 227 | 4682026 | 24038.35 | 761 | 747 | 194.7 |
| D | 8 | 195 | 4169352 | 21405.77 | 761 | 747 | 194.7 |
| D | 2 | 250 | 881038 | 4520.29 | 761 | 747 | 194.7 |
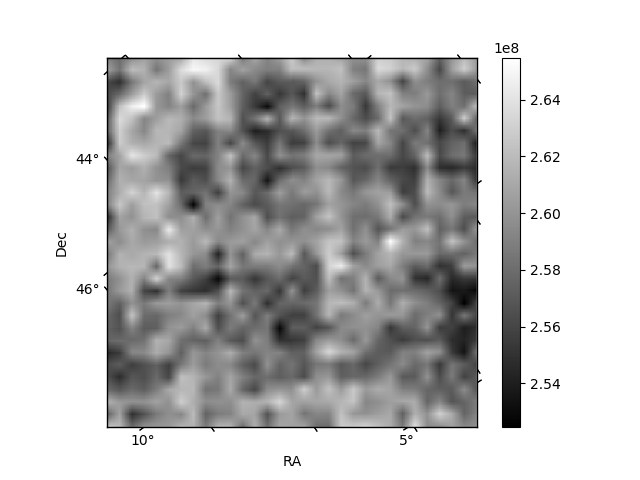
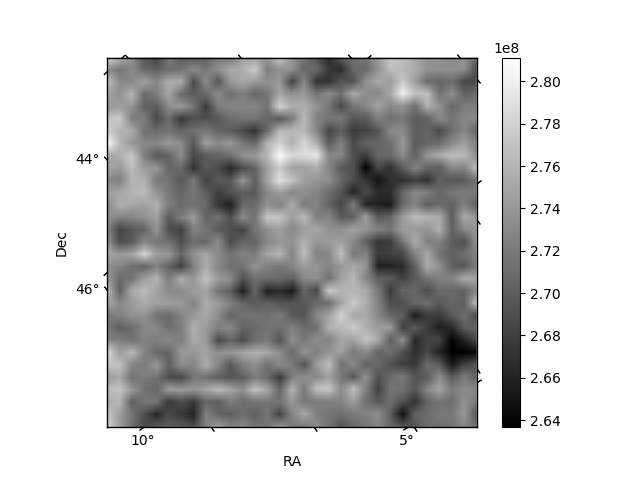
Histogram calculated using DETX and DETY for each event in the final _common_clean file
| Quadrant A | 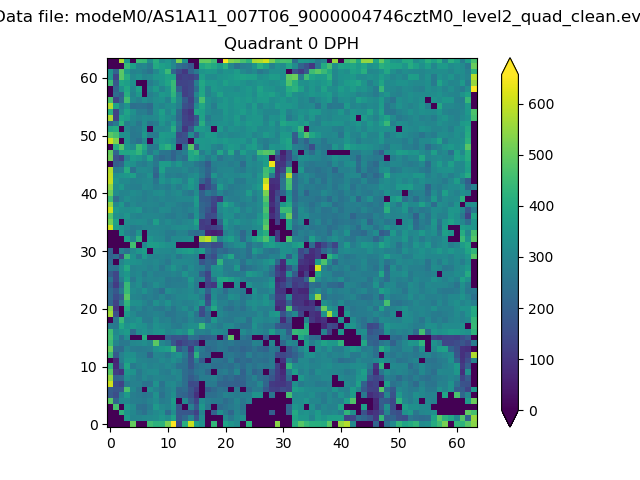 |
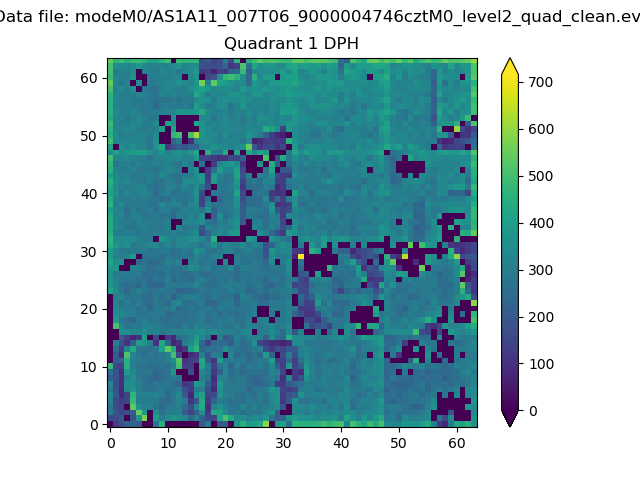 |
Quadrant B |
|---|---|---|---|
| Quadrant D |  |
 |
Quadrant C |
| Plot type | Count rate plots | Images |
|---|---|---|
| Comparison with Poisson distribution Blue bars denote a histogram of data divided into 1 sec bins. Red curve is a Poisson curve with rate = median count rate of data. |
 |
 |
| Quadrant-wise count rates Data is divided into 100 sec bins |
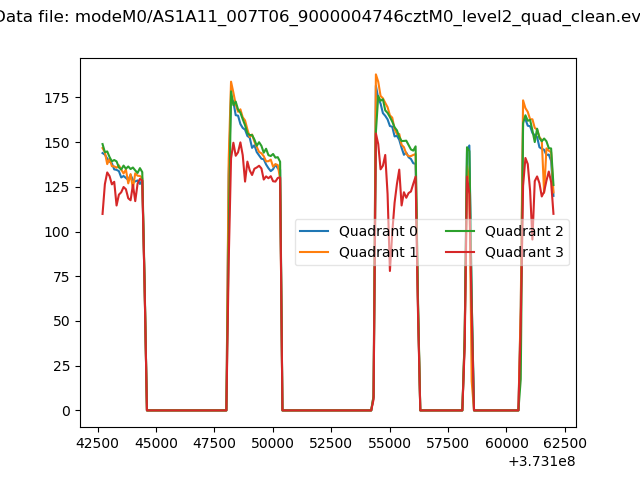 |
|
| Module-wise count rates for Quadrant A Data is divided into 100 sec bins |
 |
 |
| Module-wise count rates for Quadrant B Data is divided into 100 sec bins |
 |
 |
| Module-wise count rates for Quadrant C Data is divided into 100 sec bins |
 |
 |
| Module-wise count rates for Quadrant D Data is divided into 100 sec bins |
 |
 |
| Parameter | Plot |
|---|---|
| CZT HV Monitor |  |
| D_VDD | 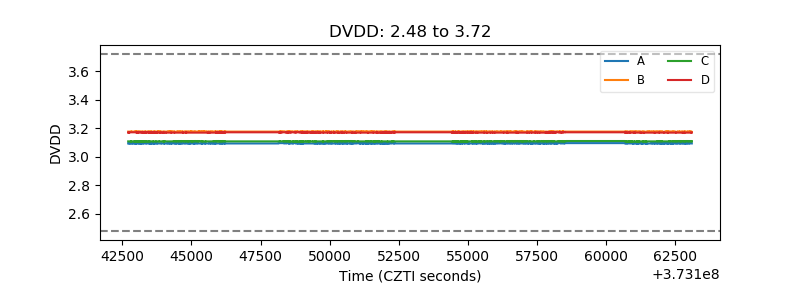 |
| Temperature 1 |  |
| Veto HV Monitor |  |
| Veto LLD |  |
| Alpha Counter |  |
| _CPM_Rate | 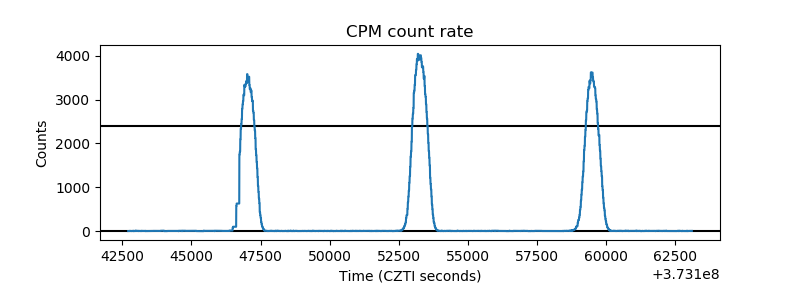 |
| CZT Counter |  |
| +2.5 Volts monitor |  |
| +5 Volts monitor | 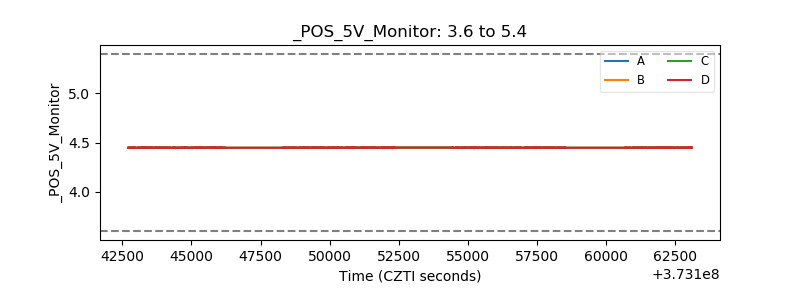 |
| _ROLL_ROT |  |
| _Roll_DEC |  |
| _Roll_RA | 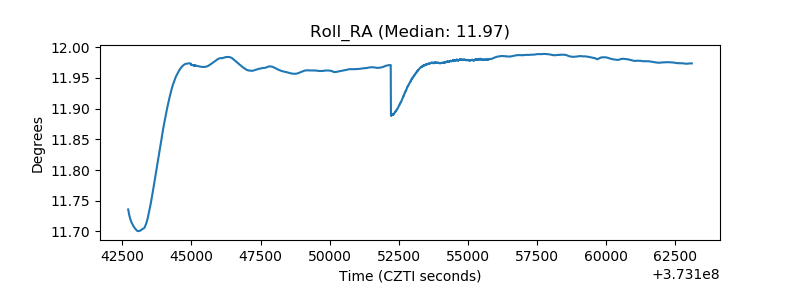 |
| Veto Counter |  |