| Param | Original file | Final file |
|---|---|---|
| Filename | modeM0/AS1A11_005T05_9000004744cztM0_level2_bc.evt | modeM0/AS1A11_005T05_9000004744cztM0_level2_quad_clean.evt |
| Size (bytes) | 266,313,600 | 75,116,160 |
| Size | 254.0 MB | 71.6 MB |
| Events in quadrant A | 1,122,790 | 492,013 |
| Events in quadrant B | 1,376,991 | 493,998 |
| Events in quadrant C | 1,367,673 | 496,167 |
| Events in quadrant D | 3,852,205 | 443,387 |
| Mode SS | |||
|---|---|---|---|
| Quadrant | BADHDUFLAG | Total packets | Discarded packets |
| A | 0 | 102 | 0 |
| B | 0 | 102 | 0 |
| C | 0 | 102 | 0 |
| D | 0 | 102 | 0 |
| Mode M9 | |||
|---|---|---|---|
| Quadrant | BADHDUFLAG | Total packets | Discarded packets |
| A | 0 | 23 | 0 |
| B | 0 | 23 | 0 |
| C | 0 | 23 | 0 |
| D | 0 | 24 | 0 |
| Mode M0 | |||
|---|---|---|---|
| Quadrant | BADHDUFLAG | Total packets | Discarded packets |
| A | 0 | 10435 | 0 |
| B | 0 | 11481 | 0 |
| C | 0 | 11132 | 0 |
| D | 0 | 19767 | 0 |
| Quadrant | Total seconds | Saturated seconds | Saturation percentage |
|---|---|---|---|
| A | 4974 | 14 | 0.281464% |
| B | 4974 | 72 | 1.447527% |
| C | 4974 | 61 | 1.226377% |
| D | 4974 | 448 | 9.006836% |
Noise dominated data is calculated using 1-second bins in cleaned event files. If a bin has >2000 counts, and if more than 50% of those come from <1% of pixels, then it is considered to be noise-dominated and hence unusable.
| Quadrant | # 1 sec bins | Bins with >0 counts | Bins with >2000 counts | High rate bins dominated by noise | Noise dominated (total time) | Noise dominated (detector-on time) | Marked lightcurve |
|---|---|---|---|---|---|---|---|
| A | 6766 | 4973 | 0 | 0 | 0.00% | 0.00% |  |
| B | 6766 | 4973 | 6 | 6 | 0.09% | 0.12% |  |
| C | 6766 | 4973 | 7 | 7 | 0.10% | 0.14% | 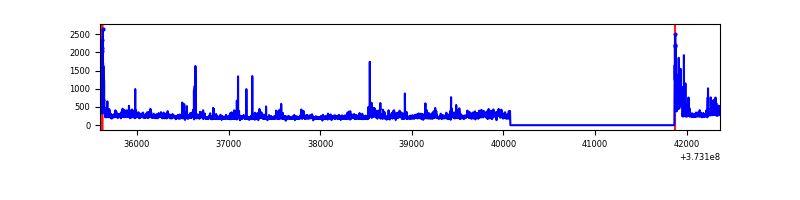 |
| D | 6766 | 4973 | 78 | 78 | 1.15% | 1.57% | 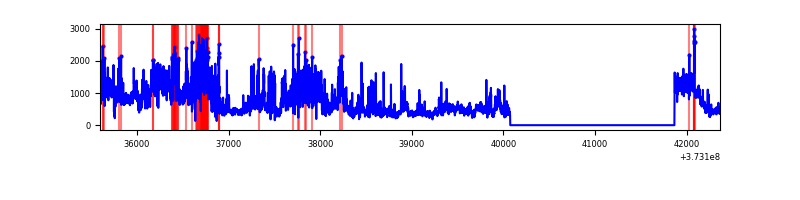 |
Top three noisy pixels from each quadrant. If the there are fewer than three noisy pixels in the level2.evt file, extra rows are filled as -1
| Pixel properties | Quadrant properties | ||||||
|---|---|---|---|---|---|---|---|
| Quadrant | DetID | PixID | Counts | Sigma | Mean | Median | Sigma |
| A | 14 | 63 | 28884 | 470.77 | 266 | 261 | 60.8 |
| A | 7 | 16 | 28618 | 466.4 | 266 | 261 | 60.8 |
| A | 9 | 143 | 14612 | 236.04 | 266 | 261 | 60.8 |
| B | 5 | 172 | 158331 | 2914.7 | 267 | 261 | 54.2 |
| B | 0 | 199 | 36351 | 665.47 | 267 | 261 | 54.2 |
| B | 0 | 219 | 35534 | 650.41 | 267 | 261 | 54.2 |
| C | 0 | 10 | 174155 | 2757.96 | 265 | 263 | 63.1 |
| C | 14 | 67 | 101308 | 1602.59 | 265 | 263 | 63.1 |
| C | 0 | 207 | 19796 | 309.8 | 265 | 263 | 63.1 |
| D | 8 | 195 | 1130731 | 17151.73 | 254 | 247 | 65.9 |
| D | 2 | 250 | 565708 | 8579.19 | 254 | 247 | 65.9 |
| D | 10 | 203 | 516988 | 7840.0 | 254 | 247 | 65.9 |
Histogram calculated using DETX and DETY for each event in the final _common_clean file
| Quadrant A |  |
 |
Quadrant B |
|---|---|---|---|
| Quadrant D | 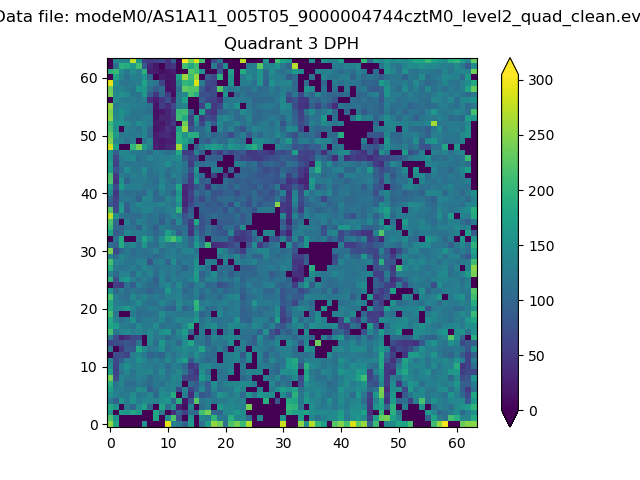 |
 |
Quadrant C |
| Plot type | Count rate plots | Images |
|---|---|---|
| Comparison with Poisson distribution Blue bars denote a histogram of data divided into 1 sec bins. Red curve is a Poisson curve with rate = median count rate of data. |
 |
 |
| Quadrant-wise count rates Data is divided into 100 sec bins |
 |
|
| Module-wise count rates for Quadrant A Data is divided into 100 sec bins |
 |
 |
| Module-wise count rates for Quadrant B Data is divided into 100 sec bins |
 |
 |
| Module-wise count rates for Quadrant C Data is divided into 100 sec bins |
 |
 |
| Module-wise count rates for Quadrant D Data is divided into 100 sec bins |
 |
 |
| Parameter | Plot |
|---|---|
| CZT HV Monitor |  |
| D_VDD |  |
| Temperature 1 |  |
| Veto HV Monitor |  |
| Veto LLD |  |
| Alpha Counter |  |
| _CPM_Rate | 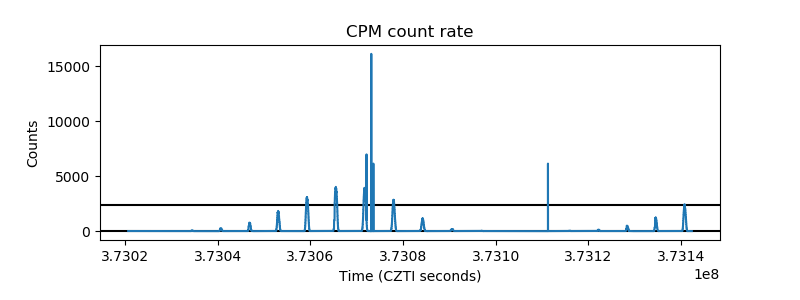 |
| CZT Counter |  |
| +2.5 Volts monitor |  |
| +5 Volts monitor |  |
| _ROLL_ROT |  |
| _Roll_DEC |  |
| _Roll_RA |  |
| Veto Counter |  |