| Param | Original file | Final file |
|---|---|---|
| Filename | modeM0/AS1A11_088T02_9000004740cztM0_level2_bc.evt | modeM0/AS1A11_088T02_9000004740cztM0_level2_quad_clean.evt |
| Size (bytes) | 806,952,960 | 125,196,480 |
| Size | 769.6 MB | 119.4 MB |
| Events in quadrant A | 2,453,898 | 765,249 |
| Events in quadrant B | 3,858,826 | 755,221 |
| Events in quadrant C | 3,628,848 | 753,059 |
| Events in quadrant D | 13,680,453 | 691,841 |
| Mode SS | |||
|---|---|---|---|
| Quadrant | BADHDUFLAG | Total packets | Discarded packets |
| A | 0 | 242 | 0 |
| B | 0 | 242 | 0 |
| C | 0 | 242 | 0 |
| D | 0 | 242 | 0 |
| Mode M0 | |||
|---|---|---|---|
| Quadrant | BADHDUFLAG | Total packets | Discarded packets |
| A | 0 | 24271 | 0 |
| B | 0 | 30008 | 0 |
| C | 0 | 28230 | 0 |
| D | 0 | 61427 | 0 |
| Mode M9 | |||
|---|---|---|---|
| Quadrant | BADHDUFLAG | Total packets | Discarded packets |
| A | 0 | 28 | 0 |
| B | 0 | 28 | 0 |
| C | 0 | 28 | 0 |
| D | 0 | 28 | 0 |
| Quadrant | Total seconds | Saturated seconds | Saturation percentage |
|---|---|---|---|
| A | 11943 | 15 | 0.125597% |
| B | 11943 | 500 | 4.186553% |
| C | 11943 | 254 | 2.126769% |
| D | 11943 | 2916 | 24.415976% |
Noise dominated data is calculated using 1-second bins in cleaned event files. If a bin has >2000 counts, and if more than 50% of those come from <1% of pixels, then it is considered to be noise-dominated and hence unusable.
| Quadrant | # 1 sec bins | Bins with >0 counts | Bins with >2000 counts | High rate bins dominated by noise | Noise dominated (total time) | Noise dominated (detector-on time) | Marked lightcurve |
|---|---|---|---|---|---|---|---|
| A | 14719 | 11943 | 0 | 0 | 0.00% | 0.00% |  |
| B | 14719 | 11943 | 40 | 40 | 0.27% | 0.33% | 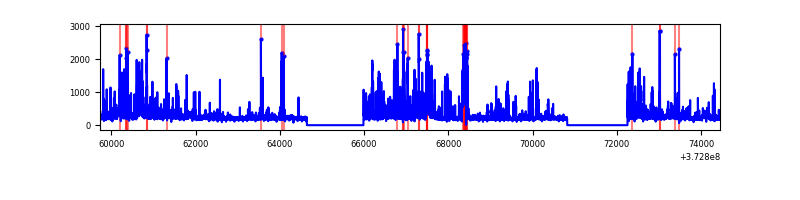 |
| C | 14719 | 11943 | 24 | 24 | 0.16% | 0.20% |  |
| D | 14719 | 11943 | 903 | 903 | 6.13% | 7.56% |  |
Top three noisy pixels from each quadrant. If the there are fewer than three noisy pixels in the level2.evt file, extra rows are filled as -1
| Pixel properties | Quadrant properties | ||||||
|---|---|---|---|---|---|---|---|
| Quadrant | DetID | PixID | Counts | Sigma | Mean | Median | Sigma |
| A | 9 | 143 | 75013 | 546.63 | 600 | 589 | 136.2 |
| A | 13 | 254 | 22316 | 159.58 | 600 | 589 | 136.2 |
| A | 15 | 174 | 19302 | 137.44 | 600 | 589 | 136.2 |
| B | 5 | 172 | 586913 | 4936.19 | 591 | 577 | 118.8 |
| B | 15 | 201 | 444319 | 3735.73 | 591 | 577 | 118.8 |
| B | 0 | 219 | 154359 | 1294.64 | 591 | 577 | 118.8 |
| C | 3 | 233 | 851207 | 6359.97 | 576 | 570 | 133.7 |
| C | 0 | 10 | 279859 | 2088.16 | 576 | 570 | 133.7 |
| C | 1 | 241 | 81983 | 608.7 | 576 | 570 | 133.7 |
| D | 8 | 195 | 4792916 | 35135.9 | 535 | 520 | 136.4 |
| D | 12 | 227 | 2401363 | 17602.01 | 535 | 520 | 136.4 |
| D | 10 | 203 | 1559967 | 11433.23 | 535 | 520 | 136.4 |
Histogram calculated using DETX and DETY for each event in the final _common_clean file
| Quadrant A |  |
 |
Quadrant B |
|---|---|---|---|
| Quadrant D |  |
 |
Quadrant C |
| Plot type | Count rate plots | Images |
|---|---|---|
| Comparison with Poisson distribution Blue bars denote a histogram of data divided into 1 sec bins. Red curve is a Poisson curve with rate = median count rate of data. |
 |
 |
| Quadrant-wise count rates Data is divided into 100 sec bins |
 |
|
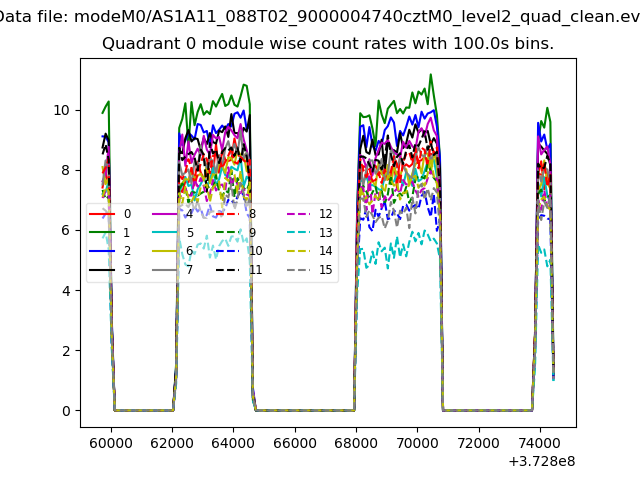
| Module-wise count rates for Quadrant A Data is divided into 100 sec bins |
 |
 |
| Module-wise count rates for Quadrant B Data is divided into 100 sec bins |
 |
 |
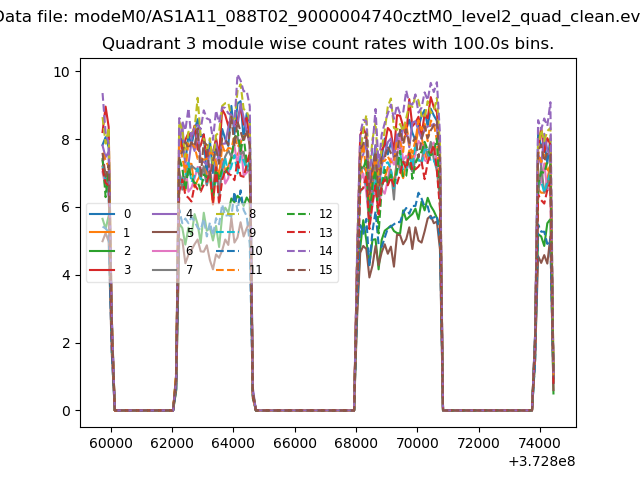
| Module-wise count rates for Quadrant C Data is divided into 100 sec bins |
 |
 |
| Module-wise count rates for Quadrant D Data is divided into 100 sec bins |
 |
 |
| Parameter | Plot |
|---|---|
| CZT HV Monitor |  |
| D_VDD | 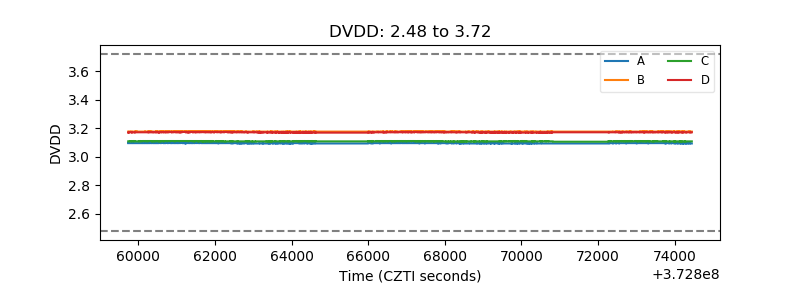 |
| Temperature 1 |  |
| Veto HV Monitor |  |
| Veto LLD |  |
| Alpha Counter |  |
| _CPM_Rate |  |
| CZT Counter |  |
| +2.5 Volts monitor |  |
| +5 Volts monitor |  |
| _ROLL_ROT |  |
| _Roll_DEC |  |
| _Roll_RA |  |
| Veto Counter |  |