| Param | Original file | Final file |
|---|---|---|
| Filename | modeM0/AS1A11_005T04_9000004742cztM0_level2_bc.evt | modeM0/AS1A11_005T04_9000004742cztM0_level2_quad_clean.evt |
| Size (bytes) | 5,275,802,880 | 1,287,685,440 |
| Size | 4.9 GB | 1.2 GB |
| Events in quadrant A | 24,268,549 | 8,265,618 |
| Events in quadrant B | 33,449,408 | 8,131,904 |
| Events in quadrant C | 25,971,255 | 8,336,868 |
| Events in quadrant D | 69,183,005 | 7,296,507 |
| Mode M9 | |||
|---|---|---|---|
| Quadrant | BADHDUFLAG | Total packets | Discarded packets |
| A | 0 | 409 | 0 |
| B | 0 | 409 | 0 |
| C | 0 | 409 | 0 |
| D | 0 | 409 | 0 |
| Mode M0 | |||
|---|---|---|---|
| Quadrant | BADHDUFLAG | Total packets | Discarded packets |
| A | 0 | 216590 | 0 |
| B | 0 | 262590 | 0 |
| C | 0 | 218552 | 0 |
| D | 0 | 369006 | 0 |
| Mode SS | |||
|---|---|---|---|
| Quadrant | BADHDUFLAG | Total packets | Discarded packets |
| A | 0 | 2078 | 0 |
| B | 0 | 2078 | 0 |
| C | 0 | 2078 | 0 |
| D | 0 | 2078 | 0 |
| Quadrant | Total seconds | Saturated seconds | Saturation percentage |
|---|---|---|---|
| A | 101848 | 419 | 0.411397% |
| B | 101729 | 6227 | 6.121165% |
| C | 101836 | 719 | 0.706037% |
| D | 101258 | 9589 | 9.469869% |
Noise dominated data is calculated using 1-second bins in cleaned event files. If a bin has >2000 counts, and if more than 50% of those come from <1% of pixels, then it is considered to be noise-dominated and hence unusable.
| Quadrant | # 1 sec bins | Bins with >0 counts | Bins with >2000 counts | High rate bins dominated by noise | Noise dominated (total time) | Noise dominated (detector-on time) | Marked lightcurve |
|---|---|---|---|---|---|---|---|
| A | 144877 | 102451 | 34 | 34 | 0.02% | 0.03% |  |
| B | 144877 | 102335 | 176 | 176 | 0.12% | 0.17% | 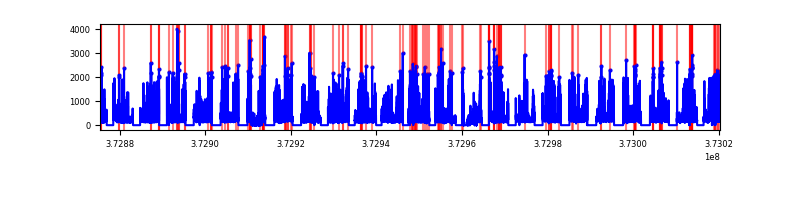 |
| C | 144877 | 102450 | 105 | 105 | 0.07% | 0.10% |  |
| D | 144877 | 101884 | 2995 | 2995 | 2.07% | 2.94% |  |
Top three noisy pixels from each quadrant. If the there are fewer than three noisy pixels in the level2.evt file, extra rows are filled as -1
| Pixel properties | Quadrant properties | ||||||
|---|---|---|---|---|---|---|---|
| Quadrant | DetID | PixID | Counts | Sigma | Mean | Median | Sigma |
| A | 14 | 63 | 2712540 | 2313.9 | 5388 | 5312 | 1170.0 |
| A | 9 | 143 | 359163 | 302.44 | 5388 | 5312 | 1170.0 |
| A | 13 | 6 | 195960 | 162.95 | 5388 | 5312 | 1170.0 |
| B | 5 | 172 | 9230780 | 8807.68 | 5359 | 5251 | 1047.4 |
| B | 0 | 197 | 976324 | 927.09 | 5359 | 5251 | 1047.4 |
| B | 0 | 230 | 606725 | 574.23 | 5359 | 5251 | 1047.4 |
| C | 3 | 233 | 1604383 | 1316.65 | 5353 | 5337 | 1214.5 |
| C | 0 | 10 | 1321680 | 1083.88 | 5353 | 5337 | 1214.5 |
| C | 14 | 67 | 1008680 | 826.15 | 5353 | 5337 | 1214.5 |
| D | 8 | 195 | 16640178 | 13573.62 | 5023 | 4910 | 1225.6 |
| D | 12 | 227 | 9211977 | 7512.55 | 5023 | 4910 | 1225.6 |
| D | 10 | 203 | 4246268 | 3460.76 | 5023 | 4910 | 1225.6 |
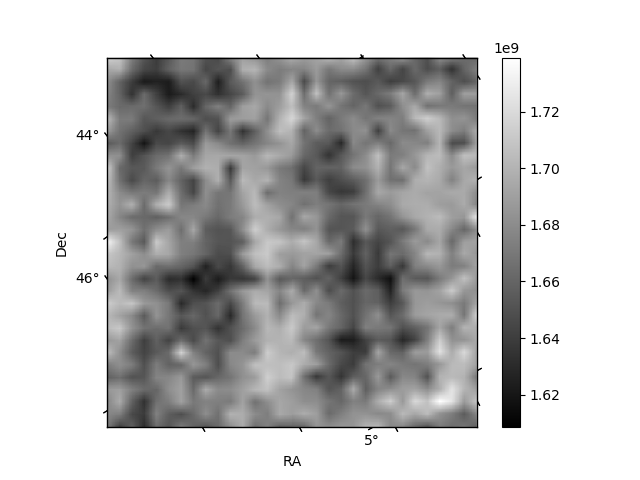
Histogram calculated using DETX and DETY for each event in the final _common_clean file
| Quadrant A |  |
 |
Quadrant B |
|---|---|---|---|
| Quadrant D |  |
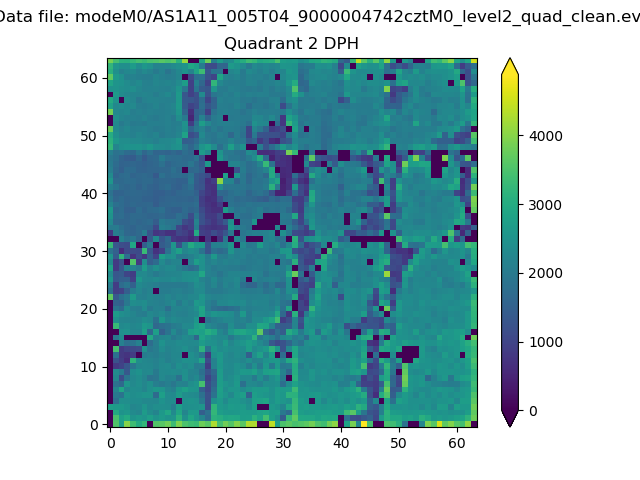 |
Quadrant C |
| Plot type | Count rate plots | Images |
|---|---|---|
| Comparison with Poisson distribution Blue bars denote a histogram of data divided into 1 sec bins. Red curve is a Poisson curve with rate = median count rate of data. |
 |
 |
| Quadrant-wise count rates Data is divided into 100 sec bins |
 |
|
| Module-wise count rates for Quadrant A Data is divided into 100 sec bins |
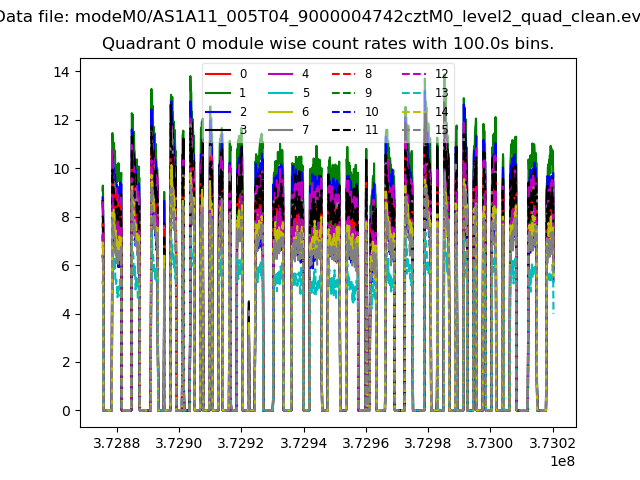 |
 |
| Module-wise count rates for Quadrant B Data is divided into 100 sec bins |
 |
 |
| Module-wise count rates for Quadrant C Data is divided into 100 sec bins |
 |
 |
| Module-wise count rates for Quadrant D Data is divided into 100 sec bins |
 |
 |
| Parameter | Plot |
|---|---|
| CZT HV Monitor |  |
| D_VDD |  |
| Temperature 1 |  |
| Veto HV Monitor |  |
| Veto LLD |  |
| Alpha Counter |  |
| _CPM_Rate |  |
| CZT Counter |  |
| +2.5 Volts monitor |  |
| +5 Volts monitor |  |
| _ROLL_ROT | 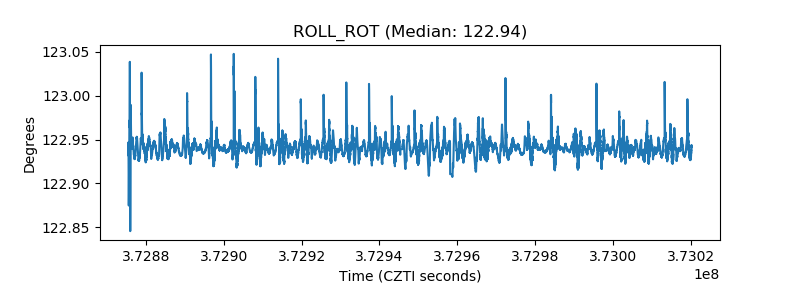 |
| _Roll_DEC |  |
| _Roll_RA |  |
| Veto Counter |  |