| Param | Original file | Final file |
|---|---|---|
| Filename | modeM0/AS1C06_002T09_9000004734cztM0_level2_bc.evt | modeM0/AS1C06_002T09_9000004734cztM0_level2_quad_clean.evt |
| Size (bytes) | 4,697,150,400 | 1,383,243,840 |
| Size | 4.4 GB | 1.3 GB |
| Events in quadrant A | 18,782,695 | 9,502,465 |
| Events in quadrant B | 26,423,412 | 9,323,936 |
| Events in quadrant C | 24,539,467 | 9,313,638 |
| Events in quadrant D | 67,094,384 | 8,285,704 |
| Mode M9 | |||
|---|---|---|---|
| Quadrant | BADHDUFLAG | Total packets | Discarded packets |
| A | 0 | 318 | 0 |
| B | 0 | 318 | 0 |
| C | 0 | 318 | 0 |
| D | 0 | 318 | 0 |
| Mode M0 | |||
|---|---|---|---|
| Quadrant | BADHDUFLAG | Total packets | Discarded packets |
| A | 0 | 168032 | 0 |
| B | 0 | 203855 | 0 |
| C | 0 | 187703 | 0 |
| D | 0 | 335168 | 0 |
| Mode SS | |||
|---|---|---|---|
| Quadrant | BADHDUFLAG | Total packets | Discarded packets |
| A | 0 | 1634 | 0 |
| B | 0 | 1634 | 0 |
| C | 0 | 1634 | 0 |
| D | 0 | 1634 | 0 |
| Quadrant | Total seconds | Saturated seconds | Saturation percentage |
|---|---|---|---|
| A | 79804 | 378 | 0.473660% |
| B | 79804 | 3574 | 4.478472% |
| C | 79804 | 1130 | 1.415969% |
| D | 79804 | 9664 | 12.109669% |
Noise dominated data is calculated using 1-second bins in cleaned event files. If a bin has >2000 counts, and if more than 50% of those come from <1% of pixels, then it is considered to be noise-dominated and hence unusable.
| Quadrant | # 1 sec bins | Bins with >0 counts | Bins with >2000 counts | High rate bins dominated by noise | Noise dominated (total time) | Noise dominated (detector-on time) | Marked lightcurve |
|---|---|---|---|---|---|---|---|
| A | 111679 | 79805 | 35 | 35 | 0.03% | 0.04% |  |
| B | 111679 | 79800 | 156 | 156 | 0.14% | 0.20% |  |
| C | 111679 | 79801 | 166 | 166 | 0.15% | 0.21% |  |
| D | 111679 | 79784 | 2441 | 2441 | 2.19% | 3.06% |  |
Top three noisy pixels from each quadrant. If the there are fewer than three noisy pixels in the level2.evt file, extra rows are filled as -1
| Pixel properties | Quadrant properties | ||||||
|---|---|---|---|---|---|---|---|
| Quadrant | DetID | PixID | Counts | Sigma | Mean | Median | Sigma |
| A | 14 | 238 | 925201 | 976.57 | 4254 | 4197 | 943.1 |
| A | 14 | 239 | 315811 | 330.42 | 4254 | 4197 | 943.1 |
| A | 14 | 207 | 310164 | 324.43 | 4254 | 4197 | 943.1 |
| B | 5 | 172 | 5450810 | 6588.5 | 4185 | 4098 | 826.7 |
| B | 0 | 219 | 1664957 | 2009.02 | 4185 | 4098 | 826.7 |
| B | 0 | 189 | 563891 | 677.14 | 4185 | 4098 | 826.7 |
| C | 3 | 233 | 3461305 | 3652.38 | 4118 | 4102 | 946.6 |
| C | 9 | 160 | 2169471 | 2287.61 | 4118 | 4102 | 946.6 |
| C | 0 | 10 | 1175751 | 1237.79 | 4118 | 4102 | 946.6 |
| D | 8 | 195 | 23857684 | 25261.58 | 3875 | 3789 | 944.3 |
| D | 7 | 80 | 7799314 | 8255.56 | 3875 | 3789 | 944.3 |
| D | 2 | 250 | 5319981 | 5629.92 | 3875 | 3789 | 944.3 |
Histogram calculated using DETX and DETY for each event in the final _common_clean file
| Quadrant A |  |
 |
Quadrant B |
|---|---|---|---|
| Quadrant D | 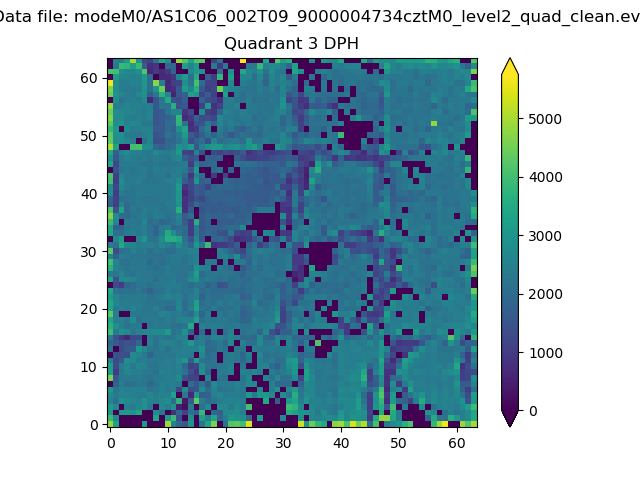 |
 |
Quadrant C |
| Plot type | Count rate plots | Images |
|---|---|---|
| Comparison with Poisson distribution Blue bars denote a histogram of data divided into 1 sec bins. Red curve is a Poisson curve with rate = median count rate of data. |
 |
 |
| Quadrant-wise count rates Data is divided into 100 sec bins |
 |
|
| Module-wise count rates for Quadrant A Data is divided into 100 sec bins |
 |
 |
| Module-wise count rates for Quadrant B Data is divided into 100 sec bins |
 |
 |
| Module-wise count rates for Quadrant C Data is divided into 100 sec bins |
 |
 |
| Module-wise count rates for Quadrant D Data is divided into 100 sec bins |
 |
 |
| Parameter | Plot |
|---|---|
| CZT HV Monitor | 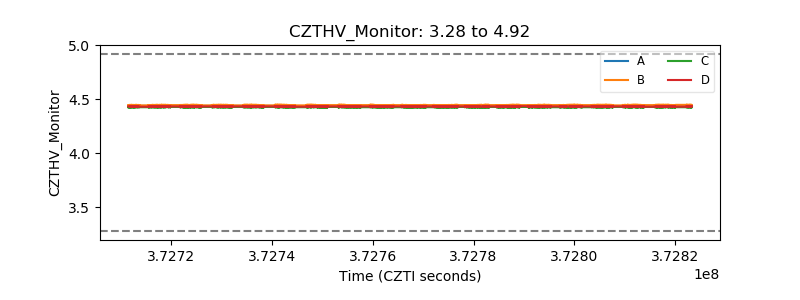 |
| D_VDD |  |
| Temperature 1 |  |
| Veto HV Monitor |  |
| Veto LLD |  |
| Alpha Counter |  |
| _CPM_Rate |  |
| CZT Counter |  |
| +2.5 Volts monitor |  |
| +5 Volts monitor |  |
| _ROLL_ROT |  |
| _Roll_DEC |  |
| _Roll_RA |  |
| Veto Counter |  |