| Param | Original file | Final file |
|---|---|---|
| Filename | modeM0/AS1A11_044T01_9000004732cztM0_level2_bc.evt | modeM0/AS1A11_044T01_9000004732cztM0_level2_quad_clean.evt |
| Size (bytes) | 3,824,164,800 | 1,202,330,880 |
| Size | 3.6 GB | 1.1 GB |
| Events in quadrant A | 16,561,935 | 8,154,128 |
| Events in quadrant B | 20,346,686 | 8,214,933 |
| Events in quadrant C | 17,317,634 | 8,338,010 |
| Events in quadrant D | 57,341,180 | 7,416,121 |
| Mode M9 | |||
|---|---|---|---|
| Quadrant | BADHDUFLAG | Total packets | Discarded packets |
| A | 0 | 238 | 0 |
| B | 0 | 238 | 0 |
| C | 0 | 238 | 0 |
| D | 0 | 238 | 0 |
| Mode M0 | |||
|---|---|---|---|
| Quadrant | BADHDUFLAG | Total packets | Discarded packets |
| A | 0 | 139469 | 0 |
| B | 0 | 156753 | 0 |
| C | 0 | 138352 | 0 |
| D | 0 | 275054 | 0 |
| Mode SS | |||
|---|---|---|---|
| Quadrant | BADHDUFLAG | Total packets | Discarded packets |
| A | 0 | 1284 | 0 |
| B | 0 | 1284 | 0 |
| C | 0 | 1284 | 0 |
| D | 0 | 1284 | 0 |
| Quadrant | Total seconds | Saturated seconds | Saturation percentage |
|---|---|---|---|
| A | 62613 | 897 | 1.432610% |
| B | 62613 | 2577 | 4.115759% |
| C | 62613 | 700 | 1.117979% |
| D | 62613 | 7850 | 12.537333% |
Noise dominated data is calculated using 1-second bins in cleaned event files. If a bin has >2000 counts, and if more than 50% of those come from <1% of pixels, then it is considered to be noise-dominated and hence unusable.
| Quadrant | # 1 sec bins | Bins with >0 counts | Bins with >2000 counts | High rate bins dominated by noise | Noise dominated (total time) | Noise dominated (detector-on time) | Marked lightcurve |
|---|---|---|---|---|---|---|---|
| A | 86657 | 62611 | 56 | 56 | 0.06% | 0.09% |  |
| B | 86657 | 62607 | 135 | 135 | 0.16% | 0.22% |  |
| C | 86657 | 62611 | 217 | 217 | 0.25% | 0.35% | 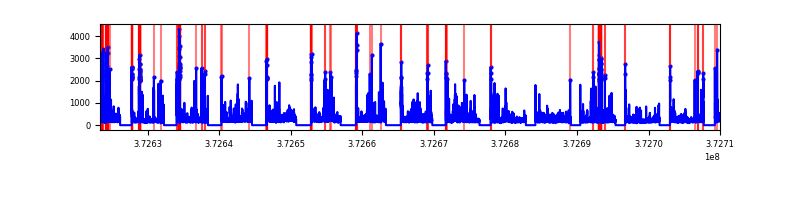 |
| D | 86657 | 62599 | 2018 | 2018 | 2.33% | 3.22% |  |
Top three noisy pixels from each quadrant. If the there are fewer than three noisy pixels in the level2.evt file, extra rows are filled as -1
| Pixel properties | Quadrant properties | ||||||
|---|---|---|---|---|---|---|---|
| Quadrant | DetID | PixID | Counts | Sigma | Mean | Median | Sigma |
| A | 14 | 238 | 2353000 | 3257.71 | 3282 | 3237 | 721.3 |
| A | 15 | 17 | 703381 | 970.68 | 3282 | 3237 | 721.3 |
| A | 9 | 143 | 337930 | 464.02 | 3282 | 3237 | 721.3 |
| B | 5 | 172 | 3570895 | 5504.7 | 3304 | 3241 | 648.1 |
| B | 0 | 219 | 1088413 | 1674.36 | 3304 | 3241 | 648.1 |
| B | 5 | 200 | 543927 | 834.25 | 3304 | 3241 | 648.1 |
| C | 0 | 10 | 2363548 | 3115.6 | 3294 | 3280 | 757.6 |
| C | 3 | 233 | 664374 | 872.66 | 3294 | 3280 | 757.6 |
| C | 14 | 67 | 467257 | 612.46 | 3294 | 3280 | 757.6 |
| D | 8 | 195 | 24665208 | 31943.28 | 3130 | 3063 | 772.1 |
| D | 2 | 250 | 3529437 | 4567.48 | 3130 | 3063 | 772.1 |
| D | 12 | 6 | 2863231 | 3704.59 | 3130 | 3063 | 772.1 |
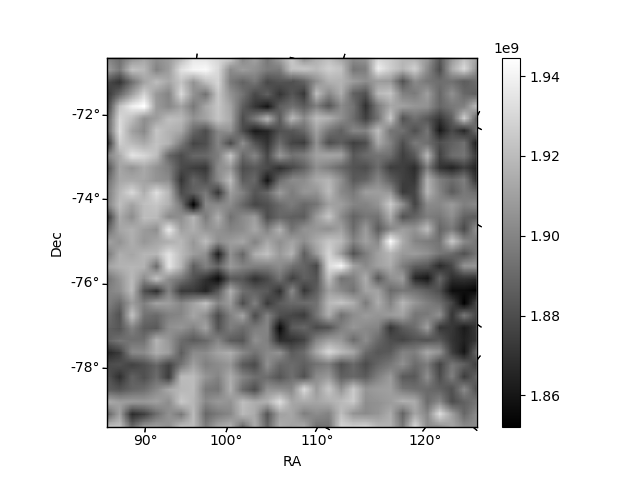
Histogram calculated using DETX and DETY for each event in the final _common_clean file
| Quadrant A |  |
 |
Quadrant B |
|---|---|---|---|
| Quadrant D |  |
 |
Quadrant C |
| Plot type | Count rate plots | Images |
|---|---|---|
| Comparison with Poisson distribution Blue bars denote a histogram of data divided into 1 sec bins. Red curve is a Poisson curve with rate = median count rate of data. |
 |
 |
| Quadrant-wise count rates Data is divided into 100 sec bins |
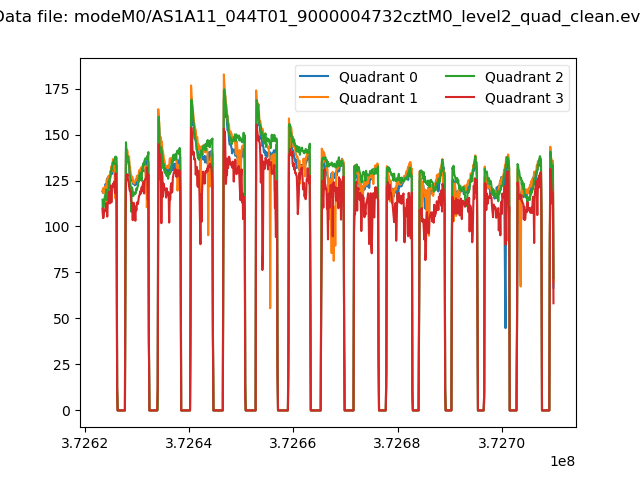 |
|
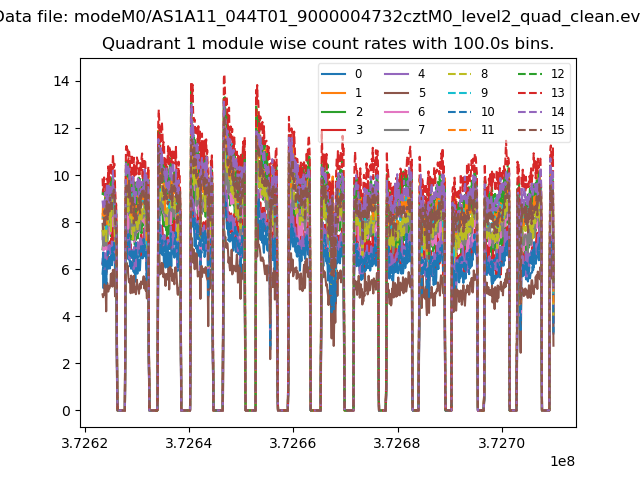
| Module-wise count rates for Quadrant A Data is divided into 100 sec bins |
 |
 |
| Module-wise count rates for Quadrant B Data is divided into 100 sec bins |
 |
 |
| Module-wise count rates for Quadrant C Data is divided into 100 sec bins |
 |
 |
| Module-wise count rates for Quadrant D Data is divided into 100 sec bins |
 |
 |
| Parameter | Plot |
|---|---|
| CZT HV Monitor |  |
| D_VDD | 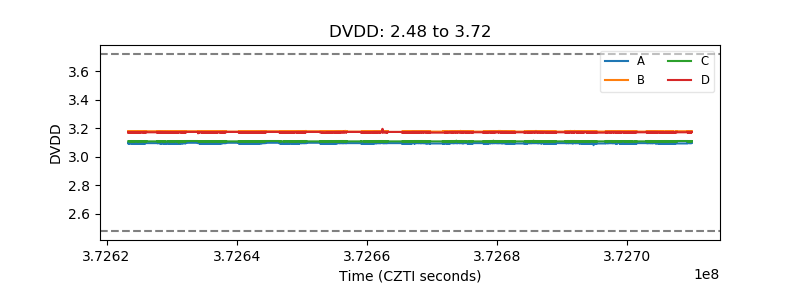 |
| Temperature 1 |  |
| Veto HV Monitor |  |
| Veto LLD |  |
| Alpha Counter |  |
| _CPM_Rate |  |
| CZT Counter |  |
| +2.5 Volts monitor |  |
| +5 Volts monitor |  |
| _ROLL_ROT | 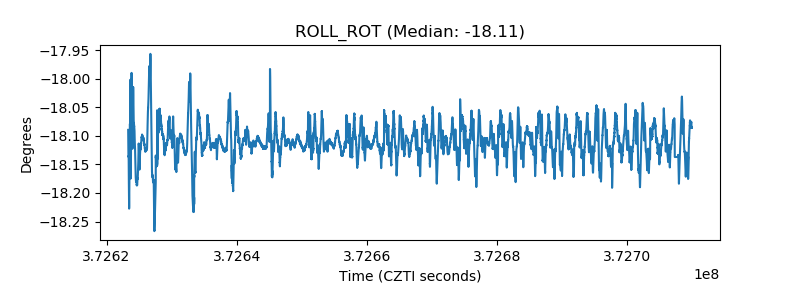 |
| _Roll_DEC |  |
| _Roll_RA |  |
| Veto Counter |  |