| Param | Original file | Final file |
|---|---|---|
| Filename | modeM0/AS1T04_064T01_9000004730cztM0_level2_bc.evt | modeM0/AS1T04_064T01_9000004730cztM0_level2_quad_clean.evt |
| Size (bytes) | 13,432,092,480 | 2,366,124,480 |
| Size | 12.5 GB | 2.2 GB |
| Events in quadrant A | 64,681,135 | 14,847,238 |
| Events in quadrant B | 63,564,012 | 15,540,015 |
| Events in quadrant C | 65,911,721 | 15,358,407 |
| Events in quadrant D | 199,954,159 | 13,065,374 |
| Mode M9 | |||
|---|---|---|---|
| Quadrant | BADHDUFLAG | Total packets | Discarded packets |
| A | 0 | 707 | 0 |
| B | 0 | 707 | 0 |
| C | 0 | 707 | 0 |
| D | 0 | 707 | 0 |
| Mode SS | |||
|---|---|---|---|
| Quadrant | BADHDUFLAG | Total packets | Discarded packets |
| A | 0 | 3828 | 0 |
| B | 0 | 3828 | 0 |
| C | 0 | 3828 | 0 |
| D | 0 | 3828 | 0 |
| Mode M0 | |||
|---|---|---|---|
| Quadrant | BADHDUFLAG | Total packets | Discarded packets |
| A | 0 | 497970 | 0 |
| B | 0 | 482983 | 0 |
| C | 0 | 467557 | 0 |
| D | 0 | 925681 | 0 |
| Quadrant | Total seconds | Saturated seconds | Saturation percentage |
|---|---|---|---|
| A | 187420 | 11607 | 6.193042% |
| B | 187420 | 6120 | 3.265393% |
| C | 187420 | 7717 | 4.117490% |
| D | 187420 | 37513 | 20.015473% |
Noise dominated data is calculated using 1-second bins in cleaned event files. If a bin has >2000 counts, and if more than 50% of those come from <1% of pixels, then it is considered to be noise-dominated and hence unusable.
| Quadrant | # 1 sec bins | Bins with >0 counts | Bins with >2000 counts | High rate bins dominated by noise | Noise dominated (total time) | Noise dominated (detector-on time) | Marked lightcurve |
|---|---|---|---|---|---|---|---|
| A | 260497 | 187384 | 1069 | 1069 | 0.41% | 0.57% |  |
| B | 260497 | 187417 | 359 | 359 | 0.14% | 0.19% |  |
| C | 260497 | 187419 | 3884 | 3884 | 1.49% | 2.07% |  |
| D | 260497 | 187415 | 13786 | 13786 | 5.29% | 7.36% |  |
Top three noisy pixels from each quadrant. If the there are fewer than three noisy pixels in the level2.evt file, extra rows are filled as -1
| Pixel properties | Quadrant properties | ||||||
|---|---|---|---|---|---|---|---|
| Quadrant | DetID | PixID | Counts | Sigma | Mean | Median | Sigma |
| A | 15 | 237 | 13818882 | 6359.34 | 9925 | 9786 | 2171.5 |
| A | 12 | 16 | 5514048 | 2534.81 | 9925 | 9786 | 2171.5 |
| A | 14 | 238 | 2109374 | 966.9 | 9925 | 9786 | 2171.5 |
| B | 5 | 172 | 8487156 | 4252.24 | 10247 | 10049 | 1993.6 |
| B | 0 | 219 | 5731451 | 2869.94 | 10247 | 10049 | 1993.6 |
| B | 12 | 1 | 2108042 | 1052.38 | 10247 | 10049 | 1993.6 |
| C | 0 | 10 | 19437756 | 8636.4 | 9851 | 9791 | 2249.5 |
| C | 3 | 233 | 3112262 | 1379.16 | 9851 | 9791 | 2249.5 |
| C | 7 | 221 | 1384552 | 611.13 | 9851 | 9791 | 2249.5 |
| D | 8 | 195 | 99215161 | 42764.67 | 9237 | 9027 | 2319.8 |
| D | 2 | 250 | 13944879 | 6007.31 | 9237 | 9027 | 2319.8 |
| D | 10 | 203 | 7747443 | 3335.79 | 9237 | 9027 | 2319.8 |
Histogram calculated using DETX and DETY for each event in the final _common_clean file
| Quadrant A | 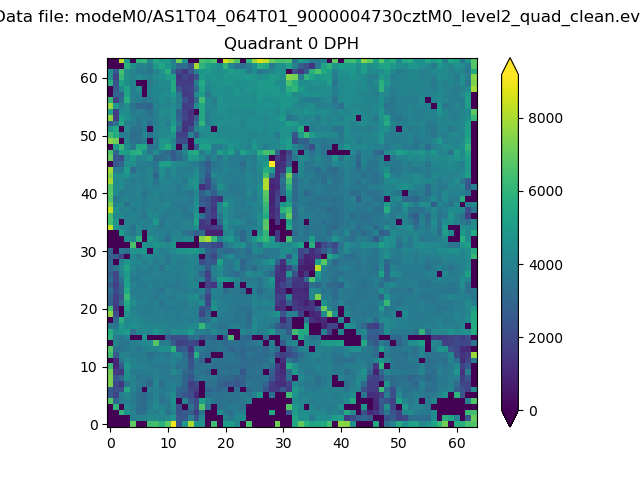 |
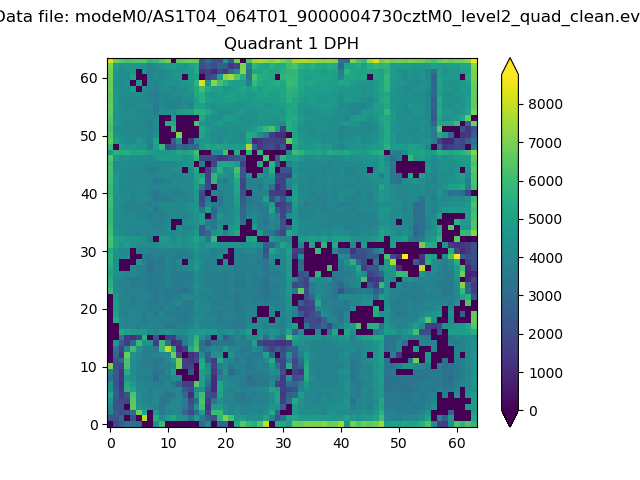 |
Quadrant B |
|---|---|---|---|
| Quadrant D |  |
 |
Quadrant C |
| Plot type | Count rate plots | Images |
|---|---|---|
| Comparison with Poisson distribution Blue bars denote a histogram of data divided into 1 sec bins. Red curve is a Poisson curve with rate = median count rate of data. |
 |
 |
| Quadrant-wise count rates Data is divided into 100 sec bins |
 |
|
| Module-wise count rates for Quadrant A Data is divided into 100 sec bins |
 |
 |
| Module-wise count rates for Quadrant B Data is divided into 100 sec bins |
 |
 |
| Module-wise count rates for Quadrant C Data is divided into 100 sec bins |
 |
 |
| Module-wise count rates for Quadrant D Data is divided into 100 sec bins |
 |
 |
| Parameter | Plot |
|---|---|
| CZT HV Monitor |  |
| D_VDD |  |
| Temperature 1 |  |
| Veto HV Monitor |  |
| Veto LLD |  |
| Alpha Counter |  |
| _CPM_Rate |  |
| CZT Counter | 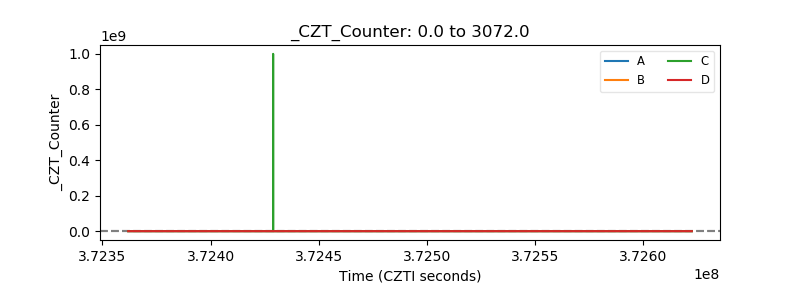 |
| +2.5 Volts monitor |  |
| +5 Volts monitor |  |
| _ROLL_ROT |  |
| _Roll_DEC |  |
| _Roll_RA | 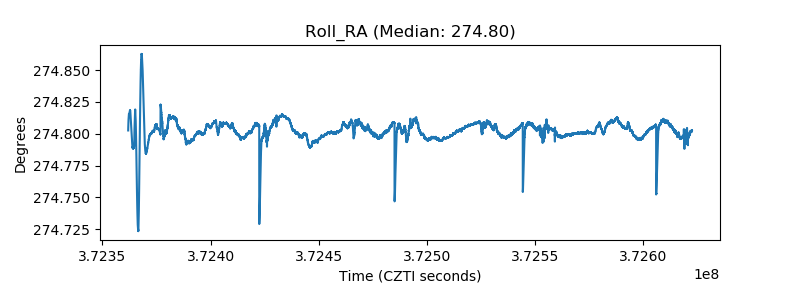 |
| Veto Counter |  |