| Param | Original file | Final file |
|---|---|---|
| Filename | modeM0/AS1A10_057T04_9000004728cztM0_level2_bc.evt | modeM0/AS1A10_057T04_9000004728cztM0_level2_quad_clean.evt |
| Size (bytes) | 5,714,890,560 | 1,384,413,120 |
| Size | 5.3 GB | 1.3 GB |
| Events in quadrant A | 29,458,473 | 8,794,885 |
| Events in quadrant B | 34,884,283 | 8,663,460 |
| Events in quadrant C | 26,097,454 | 8,833,069 |
| Events in quadrant D | 75,195,211 | 8,132,315 |
| Mode M0 | |||
|---|---|---|---|
| Quadrant | BADHDUFLAG | Total packets | Discarded packets |
| A | 0 | 246448 | 0 |
| B | 0 | 279703 | 0 |
| C | 0 | 232220 | 0 |
| D | 0 | 399673 | 0 |
| Mode M9 | |||
|---|---|---|---|
| Quadrant | BADHDUFLAG | Total packets | Discarded packets |
| A | 0 | 422 | 0 |
| B | 0 | 422 | 0 |
| C | 0 | 422 | 0 |
| D | 0 | 422 | 0 |
| Mode SS | |||
|---|---|---|---|
| Quadrant | BADHDUFLAG | Total packets | Discarded packets |
| A | 0 | 2232 | 0 |
| B | 0 | 2232 | 0 |
| C | 0 | 2232 | 0 |
| D | 0 | 2232 | 0 |
| Quadrant | Total seconds | Saturated seconds | Saturation percentage |
|---|---|---|---|
| A | 109587 | 2089 | 1.906248% |
| B | 109587 | 6033 | 5.505215% |
| C | 109587 | 625 | 0.570323% |
| D | 109586 | 10207 | 9.314146% |
Noise dominated data is calculated using 1-second bins in cleaned event files. If a bin has >2000 counts, and if more than 50% of those come from <1% of pixels, then it is considered to be noise-dominated and hence unusable.
| Quadrant | # 1 sec bins | Bins with >0 counts | Bins with >2000 counts | High rate bins dominated by noise | Noise dominated (total time) | Noise dominated (detector-on time) | Marked lightcurve |
|---|---|---|---|---|---|---|---|
| A | 151415 | 109586 | 149 | 149 | 0.10% | 0.14% |  |
| B | 151415 | 109570 | 327 | 327 | 0.22% | 0.30% |  |
| C | 151415 | 109588 | 115 | 115 | 0.08% | 0.10% |  |
| D | 151415 | 109581 | 2340 | 2340 | 1.55% | 2.14% |  |
Top three noisy pixels from each quadrant. If the there are fewer than three noisy pixels in the level2.evt file, extra rows are filled as -1
| Pixel properties | Quadrant properties | ||||||
|---|---|---|---|---|---|---|---|
| Quadrant | DetID | PixID | Counts | Sigma | Mean | Median | Sigma |
| A | 15 | 249 | 5388509 | 4326.12 | 5686 | 5605 | 1244.3 |
| A | 12 | 16 | 948677 | 757.93 | 5686 | 5605 | 1244.3 |
| A | 0 | 254 | 252193 | 198.18 | 5686 | 5605 | 1244.3 |
| B | 12 | 1 | 5520970 | 5055.99 | 5590 | 5478 | 1090.9 |
| B | 0 | 219 | 1482219 | 1353.71 | 5590 | 5478 | 1090.9 |
| B | 5 | 172 | 994111 | 906.27 | 5590 | 5478 | 1090.9 |
| C | 8 | 229 | 1496471 | 1170.91 | 5588 | 5541 | 1273.3 |
| C | 0 | 10 | 1083520 | 846.59 | 5588 | 5541 | 1273.3 |
| C | 8 | 79 | 413839 | 320.66 | 5588 | 5541 | 1273.3 |
| D | 8 | 195 | 27105991 | 20390.04 | 5362 | 5236 | 1329.1 |
| D | 2 | 250 | 7042029 | 5294.34 | 5362 | 5236 | 1329.1 |
| D | 7 | 80 | 4346538 | 3266.31 | 5362 | 5236 | 1329.1 |
Histogram calculated using DETX and DETY for each event in the final _common_clean file
| Quadrant A | 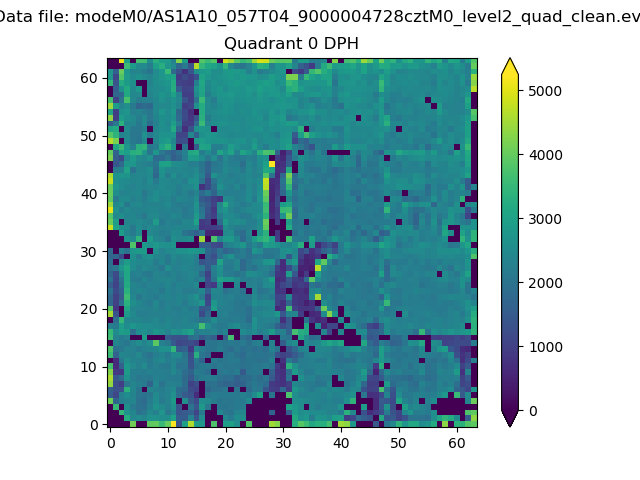 |
 |
Quadrant B |
|---|---|---|---|
| Quadrant D |  |
 |
Quadrant C |
| Plot type | Count rate plots | Images |
|---|---|---|
| Comparison with Poisson distribution Blue bars denote a histogram of data divided into 1 sec bins. Red curve is a Poisson curve with rate = median count rate of data. |
 |
 |
| Quadrant-wise count rates Data is divided into 100 sec bins |
 |
|
| Module-wise count rates for Quadrant A Data is divided into 100 sec bins |
 |
 |
| Module-wise count rates for Quadrant B Data is divided into 100 sec bins |
 |
 |
| Module-wise count rates for Quadrant C Data is divided into 100 sec bins |
 |
 |
| Module-wise count rates for Quadrant D Data is divided into 100 sec bins |
 |
 |
| Parameter | Plot |
|---|---|
| CZT HV Monitor |  |
| D_VDD | 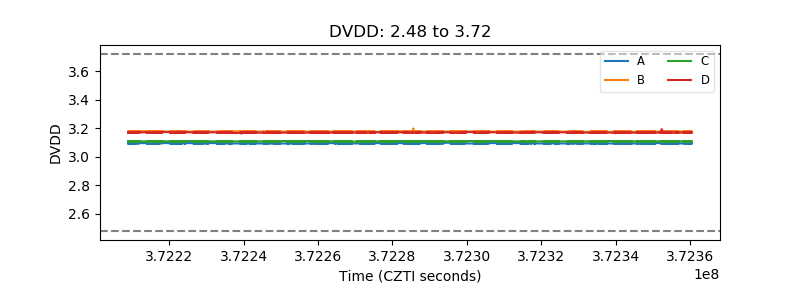 |
| Temperature 1 |  |
| Veto HV Monitor |  |
| Veto LLD |  |
| Alpha Counter |  |
| _CPM_Rate |  |
| CZT Counter |  |
| +2.5 Volts monitor |  |
| +5 Volts monitor | 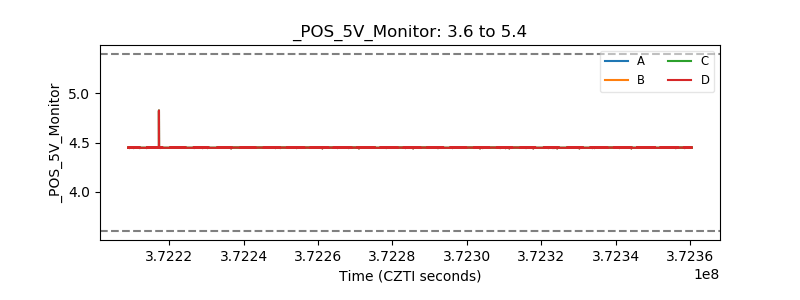 |
| _ROLL_ROT |  |
| _Roll_DEC |  |
| _Roll_RA |  |
| Veto Counter |  |