| Param | Original file | Final file |
|---|---|---|
| Filename | modeM0/AS1A10_123T04_9000004726cztM0_level2_bc.evt | modeM0/AS1A10_123T04_9000004726cztM0_level2_quad_clean.evt |
| Size (bytes) | 6,113,485,440 | 1,446,284,160 |
| Size | 5.7 GB | 1.3 GB |
| Events in quadrant A | 43,696,854 | 9,075,523 |
| Events in quadrant B | 40,616,280 | 9,246,532 |
| Events in quadrant C | 28,236,862 | 9,311,003 |
| Events in quadrant D | 65,033,910 | 8,537,753 |
| Mode M0 | |||
|---|---|---|---|
| Quadrant | BADHDUFLAG | Total packets | Discarded packets |
| A | 0 | 310708 | 0 |
| B | 0 | 300747 | 0 |
| C | 0 | 240332 | 0 |
| D | 0 | 376341 | 0 |
| Mode M9 | |||
|---|---|---|---|
| Quadrant | BADHDUFLAG | Total packets | Discarded packets |
| A | 0 | 436 | 0 |
| B | 0 | 436 | 0 |
| C | 0 | 436 | 0 |
| D | 0 | 436 | 0 |
| Mode SS | |||
|---|---|---|---|
| Quadrant | BADHDUFLAG | Total packets | Discarded packets |
| A | 0 | 2286 | 0 |
| B | 0 | 2286 | 0 |
| C | 0 | 2284 | 0 |
| D | 0 | 2276 | 0 |
| Quadrant | Total seconds | Saturated seconds | Saturation percentage |
|---|---|---|---|
| A | 111302 | 7114 | 6.391619% |
| B | 111346 | 7279 | 6.537280% |
| C | 111375 | 914 | 0.820651% |
| D | 111411 | 9039 | 8.113202% |
Noise dominated data is calculated using 1-second bins in cleaned event files. If a bin has >2000 counts, and if more than 50% of those come from <1% of pixels, then it is considered to be noise-dominated and hence unusable.
| Quadrant | # 1 sec bins | Bins with >0 counts | Bins with >2000 counts | High rate bins dominated by noise | Noise dominated (total time) | Noise dominated (detector-on time) | Marked lightcurve |
|---|---|---|---|---|---|---|---|
| A | 176409 | 111379 | 478 | 478 | 0.27% | 0.43% | 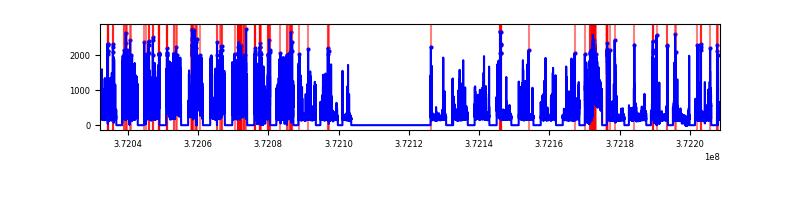 |
| B | 176409 | 111450 | 612 | 612 | 0.35% | 0.55% |  |
| C | 176409 | 111513 | 231 | 231 | 0.13% | 0.21% |  |
| D | 176409 | 111537 | 1727 | 1727 | 0.98% | 1.55% |  |
Top three noisy pixels from each quadrant. If the there are fewer than three noisy pixels in the level2.evt file, extra rows are filled as -1
| Pixel properties | Quadrant properties | ||||||
|---|---|---|---|---|---|---|---|
| Quadrant | DetID | PixID | Counts | Sigma | Mean | Median | Sigma |
| A | 15 | 249 | 19041393 | 15317.12 | 5699 | 5628 | 1242.8 |
| A | 15 | 237 | 1520124 | 1218.64 | 5699 | 5628 | 1242.8 |
| A | 10 | 228 | 274784 | 216.58 | 5699 | 5628 | 1242.8 |
| B | 12 | 1 | 8432326 | 7626.55 | 5685 | 5575 | 1104.9 |
| B | 3 | 26 | 2379372 | 2148.38 | 5685 | 5575 | 1104.9 |
| B | 4 | 251 | 2263479 | 2043.49 | 5685 | 5575 | 1104.9 |
| C | 0 | 10 | 2036021 | 1551.88 | 5703 | 5653 | 1308.3 |
| C | 3 | 233 | 1113314 | 846.62 | 5703 | 5653 | 1308.3 |
| C | 9 | 236 | 752119 | 570.55 | 5703 | 5653 | 1308.3 |
| D | 8 | 195 | 8236290 | 6252.21 | 5513 | 5391 | 1316.5 |
| D | 2 | 250 | 7868148 | 5972.57 | 5513 | 5391 | 1316.5 |
| D | 7 | 80 | 6560158 | 4979.01 | 5513 | 5391 | 1316.5 |
Histogram calculated using DETX and DETY for each event in the final _common_clean file
| Quadrant A |  |
 |
Quadrant B |
|---|---|---|---|
| Quadrant D |  |
 |
Quadrant C |
| Plot type | Count rate plots | Images |
|---|---|---|
| Comparison with Poisson distribution Blue bars denote a histogram of data divided into 1 sec bins. Red curve is a Poisson curve with rate = median count rate of data. |
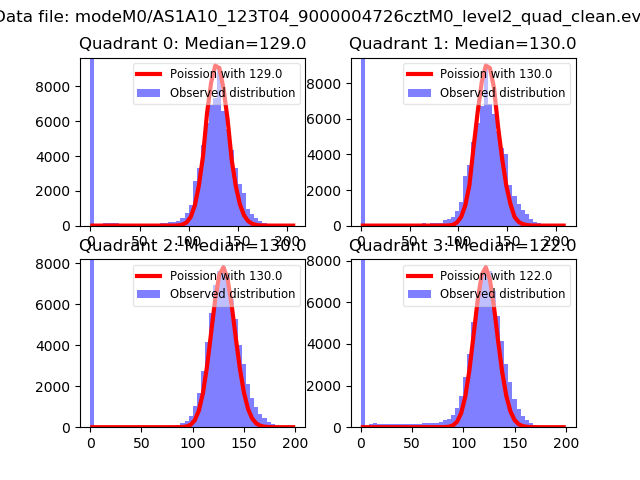 |
 |
| Quadrant-wise count rates Data is divided into 100 sec bins |
 |
|
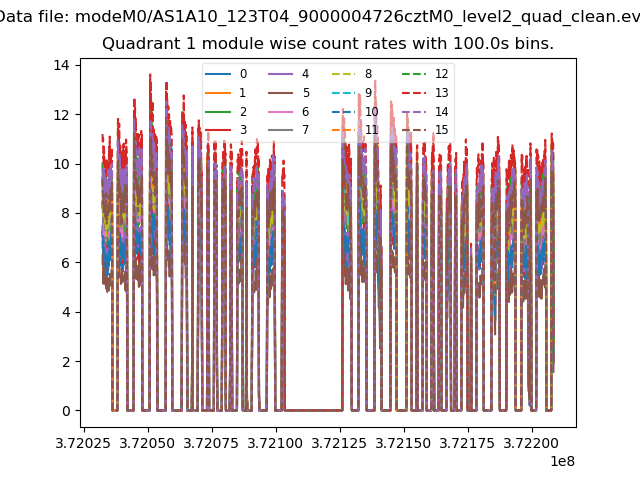
| Module-wise count rates for Quadrant A Data is divided into 100 sec bins |
 |
 |
| Module-wise count rates for Quadrant B Data is divided into 100 sec bins |
 |
 |
| Module-wise count rates for Quadrant C Data is divided into 100 sec bins |
 |
 |
| Module-wise count rates for Quadrant D Data is divided into 100 sec bins |
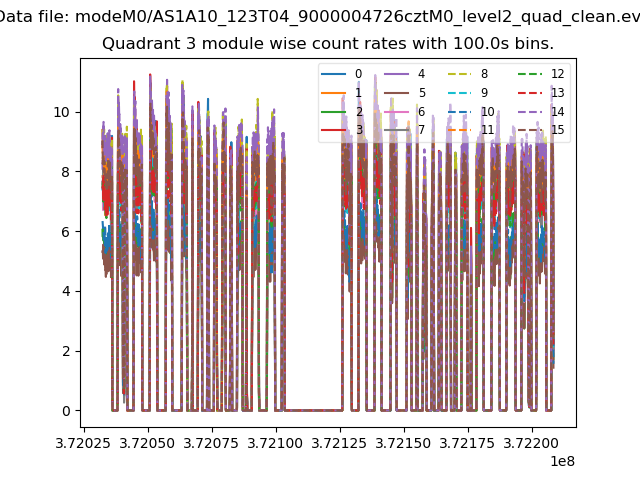 |
 |
| Parameter | Plot |
|---|---|
| CZT HV Monitor |  |
| D_VDD |  |
| Temperature 1 | 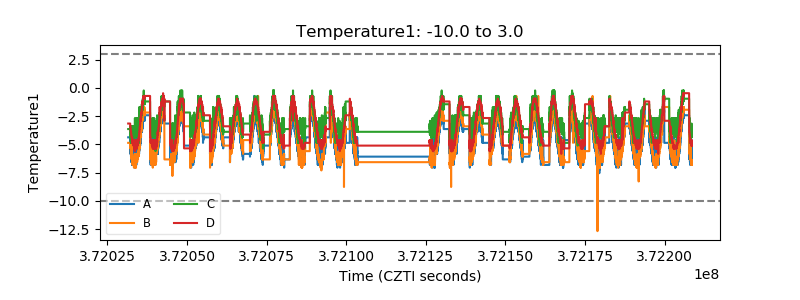 |
| Veto HV Monitor |  |
| Veto LLD |  |
| Alpha Counter |  |
| _CPM_Rate |  |
| CZT Counter |  |
| +2.5 Volts monitor |  |
| +5 Volts monitor |  |
| _ROLL_ROT |  |
| _Roll_DEC |  |
| _Roll_RA |  |
| Veto Counter | 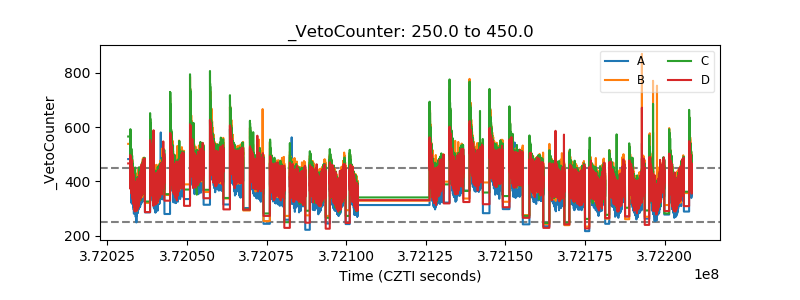 |