| Param | Original file | Final file |
|---|---|---|
| Filename | modeM0/AS1A10_057T03_9000004722cztM0_level2_bc.evt | modeM0/AS1A10_057T03_9000004722cztM0_level2_quad_clean.evt |
| Size (bytes) | 8,975,113,920 | 1,354,046,400 |
| Size | 8.4 GB | 1.3 GB |
| Events in quadrant A | 48,954,817 | 7,971,629 |
| Events in quadrant B | 64,050,937 | 8,212,243 |
| Events in quadrant C | 46,107,995 | 8,121,082 |
| Events in quadrant D | 104,745,369 | 8,659,632 |
| Mode M0 | |||
|---|---|---|---|
| Quadrant | BADHDUFLAG | Total packets | Discarded packets |
| A | 0 | 341154 | 0 |
| B | 0 | 375690 | 0 |
| C | 0 | 330740 | 0 |
| D | 0 | 592809 | 0 |
| Mode M9 | |||
|---|---|---|---|
| Quadrant | BADHDUFLAG | Total packets | Discarded packets |
| A | 0 | 472 | 0 |
| B | 0 | 472 | 0 |
| C | 0 | 471 | 0 |
| D | 0 | 535 | 0 |
| Mode SS | |||
|---|---|---|---|
| Quadrant | BADHDUFLAG | Total packets | Discarded packets |
| A | 0 | 2320 | 0 |
| B | 0 | 2318 | 0 |
| C | 0 | 2318 | 0 |
| D | 0 | 2640 | 0 |
| Quadrant | Total seconds | Saturated seconds | Saturation percentage |
|---|---|---|---|
| A | 113422 | 11570 | 10.200843% |
| B | 113361 | 12430 | 10.964970% |
| C | 113311 | 9730 | 8.586986% |
| D | 128913 | 36691 | 28.461831% |
Noise dominated data is calculated using 1-second bins in cleaned event files. If a bin has >2000 counts, and if more than 50% of those come from <1% of pixels, then it is considered to be noise-dominated and hence unusable.
| Quadrant | # 1 sec bins | Bins with >0 counts | Bins with >2000 counts | High rate bins dominated by noise | Noise dominated (total time) | Noise dominated (detector-on time) | Marked lightcurve |
|---|---|---|---|---|---|---|---|
| A | 209260 | 113336 | 1137 | 1137 | 0.54% | 1.00% | 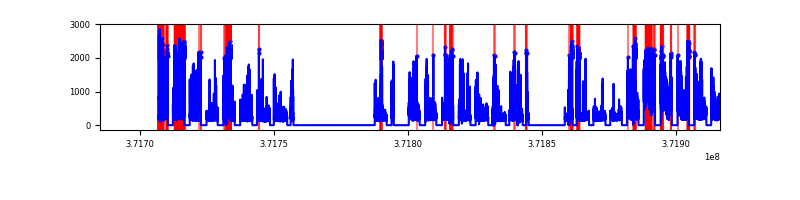 |
| B | 209199 | 113361 | 2390 | 2390 | 1.14% | 2.11% |  |
| C | 209106 | 113266 | 587 | 587 | 0.28% | 0.52% | 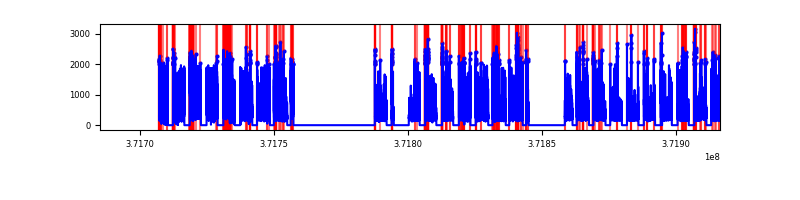 |
| D | 231112 | 128904 | 2983 | 2983 | 1.29% | 2.31% |  |
Top three noisy pixels from each quadrant. If the there are fewer than three noisy pixels in the level2.evt file, extra rows are filled as -1
| Pixel properties | Quadrant properties | ||||||
|---|---|---|---|---|---|---|---|
| Quadrant | DetID | PixID | Counts | Sigma | Mean | Median | Sigma |
| A | 15 | 249 | 18110225 | 14400.24 | 5796 | 5715 | 1257.2 |
| A | 1 | 39 | 3992882 | 3171.37 | 5796 | 5715 | 1257.2 |
| A | 0 | 253 | 1456562 | 1154.0 | 5796 | 5715 | 1257.2 |
| B | 3 | 43 | 15368950 | 13255.77 | 5864 | 5734 | 1159.0 |
| B | 3 | 26 | 6472247 | 5579.47 | 5864 | 5734 | 1159.0 |
| B | 0 | 219 | 4208048 | 3625.86 | 5864 | 5734 | 1159.0 |
| C | 8 | 35 | 5772323 | 4409.83 | 5682 | 5624 | 1307.7 |
| C | 0 | 10 | 4353452 | 3324.81 | 5682 | 5624 | 1307.7 |
| C | 9 | 236 | 3164516 | 2415.62 | 5682 | 5624 | 1307.7 |
| D | 7 | 38 | 18931392 | 14138.59 | 5717 | 5591 | 1338.6 |
| D | 8 | 195 | 10181296 | 7601.8 | 5717 | 5591 | 1338.6 |
| D | 7 | 80 | 9844942 | 7350.53 | 5717 | 5591 | 1338.6 |
Histogram calculated using DETX and DETY for each event in the final _common_clean file
| Quadrant A |  |
 |
Quadrant B |
|---|---|---|---|
| Quadrant D |  |
 |
Quadrant C |
| Plot type | Count rate plots | Images |
|---|---|---|
| Comparison with Poisson distribution Blue bars denote a histogram of data divided into 1 sec bins. Red curve is a Poisson curve with rate = median count rate of data. |
 |
 |
| Quadrant-wise count rates Data is divided into 100 sec bins |
 |
|
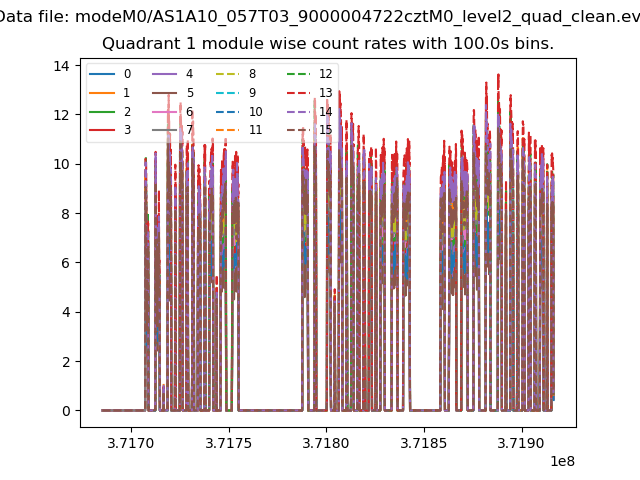
| Module-wise count rates for Quadrant A Data is divided into 100 sec bins |
 |
 |
| Module-wise count rates for Quadrant B Data is divided into 100 sec bins |
 |
 |
| Module-wise count rates for Quadrant C Data is divided into 100 sec bins |
 |
 |
| Module-wise count rates for Quadrant D Data is divided into 100 sec bins |
 |
 |
| Parameter | Plot |
|---|---|
| CZT HV Monitor |  |
| D_VDD |  |
| Temperature 1 |  |
| Veto HV Monitor | 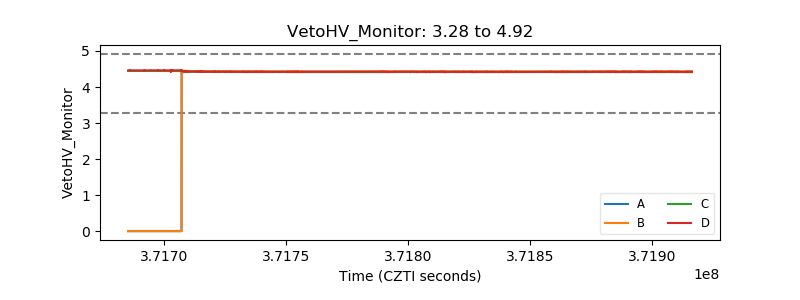 |
| Veto LLD |  |
| Alpha Counter | 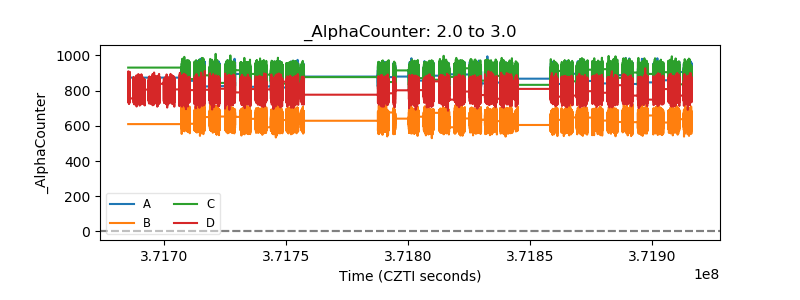 |
| _CPM_Rate | 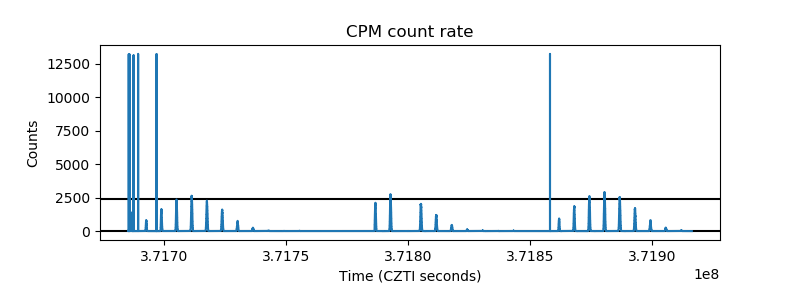 |
| CZT Counter |  |
| +2.5 Volts monitor |  |
| +5 Volts monitor |  |
| _ROLL_ROT |  |
| _Roll_DEC | 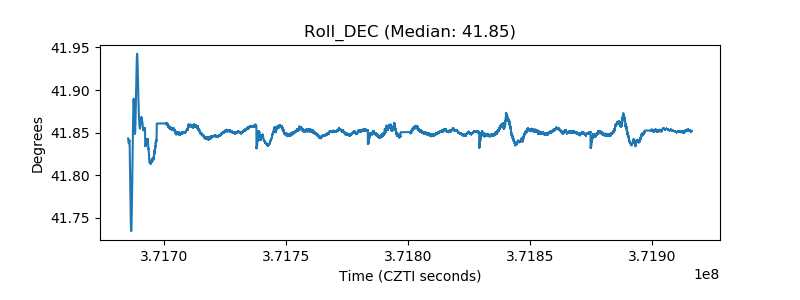 |
| _Roll_RA |  |
| Veto Counter |  |