| Param | Original file | Final file |
|---|---|---|
| Filename | modeM0/AS1T04_059T01_9000004704cztM0_level2_bc.evt | modeM0/AS1T04_059T01_9000004704cztM0_level2_quad_clean.evt |
| Size (bytes) | 14,176,584,000 | 2,478,130,560 |
| Size | 13.2 GB | 2.3 GB |
| Events in quadrant A | 43,567,349 | 17,346,372 |
| Events in quadrant B | 170,388,896 | 15,267,389 |
| Events in quadrant C | 115,132,551 | 13,002,619 |
| Events in quadrant D | 86,798,408 | 15,840,555 |
| Mode M0 | |||
|---|---|---|---|
| Quadrant | BADHDUFLAG | Total packets | Discarded packets |
| A | 0 | 417300 | 0 |
| B | 0 | 895802 | 0 |
| C | 0 | 801652 | 0 |
| D | 0 | 563018 | 0 |
| Mode M9 | |||
|---|---|---|---|
| Quadrant | BADHDUFLAG | Total packets | Discarded packets |
| A | 0 | 317 | 0 |
| B | 0 | 317 | 0 |
| C | 0 | 317 | 0 |
| D | 0 | 317 | 0 |
| Mode SS | |||
|---|---|---|---|
| Quadrant | BADHDUFLAG | Total packets | Discarded packets |
| A | 0 | 4042 | 0 |
| B | 0 | 4042 | 0 |
| C | 0 | 4042 | 0 |
| D | 0 | 4042 | 0 |
| Quadrant | Total seconds | Saturated seconds | Saturation percentage |
|---|---|---|---|
| A | 198079 | 2548 | 1.286355% |
| B | 198063 | 48201 | 24.336196% |
| C | 198061 | 60254 | 30.421941% |
| D | 198068 | 10103 | 5.100773% |
Noise dominated data is calculated using 1-second bins in cleaned event files. If a bin has >2000 counts, and if more than 50% of those come from <1% of pixels, then it is considered to be noise-dominated and hence unusable.
| Quadrant | # 1 sec bins | Bins with >0 counts | Bins with >2000 counts | High rate bins dominated by noise | Noise dominated (total time) | Noise dominated (detector-on time) | Marked lightcurve |
|---|---|---|---|---|---|---|---|
| A | 248136 | 198104 | 52 | 52 | 0.02% | 0.03% |  |
| B | 248136 | 198083 | 429 | 429 | 0.17% | 0.22% |  |
| C | 248136 | 197867 | 5651 | 5651 | 2.28% | 2.86% | 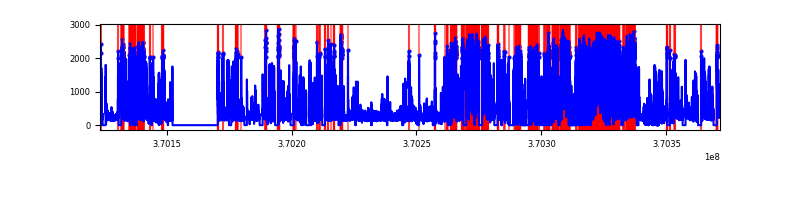 |
| D | 248136 | 198086 | 1355 | 1355 | 0.55% | 0.68% |  |
Top three noisy pixels from each quadrant. If the there are fewer than three noisy pixels in the level2.evt file, extra rows are filled as -1
| Pixel properties | Quadrant properties | ||||||
|---|---|---|---|---|---|---|---|
| Quadrant | DetID | PixID | Counts | Sigma | Mean | Median | Sigma |
| A | 0 | 6 | 729086 | 304.33 | 10854 | 10685 | 2360.6 |
| A | 13 | 254 | 370080 | 152.25 | 10854 | 10685 | 2360.6 |
| A | 13 | 6 | 294848 | 120.38 | 10854 | 10685 | 2360.6 |
| B | 4 | 80 | 70481558 | 36295.85 | 9989 | 9755 | 1941.6 |
| B | 6 | 159 | 49585333 | 25533.44 | 9989 | 9755 | 1941.6 |
| B | 5 | 172 | 5299014 | 2724.18 | 9989 | 9755 | 1941.6 |
| C | 3 | 233 | 77764356 | 39695.98 | 8289 | 8274 | 1958.8 |
| C | 0 | 10 | 2919407 | 1486.19 | 8289 | 8274 | 1958.8 |
| C | 14 | 67 | 708845 | 357.66 | 8289 | 8274 | 1958.8 |
| D | 8 | 195 | 17049123 | 7165.61 | 10403 | 10086 | 2377.9 |
| D | 12 | 233 | 5924718 | 2487.34 | 10403 | 10086 | 2377.9 |
| D | 1 | 47 | 5919565 | 2485.18 | 10403 | 10086 | 2377.9 |
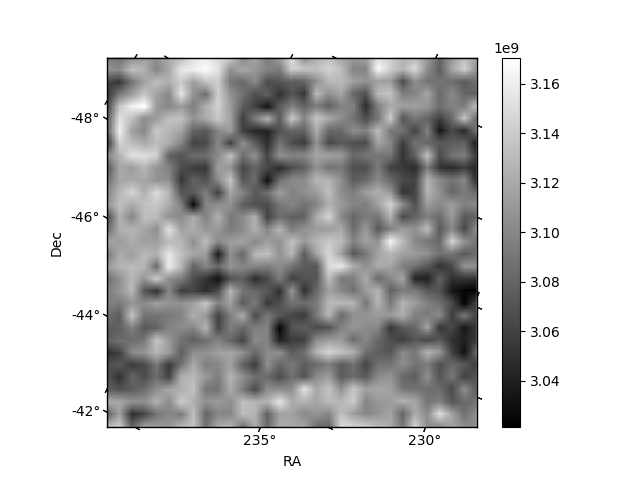
Histogram calculated using DETX and DETY for each event in the final _common_clean file
| Quadrant A |  |
 |
Quadrant B |
|---|---|---|---|
| Quadrant D |  |
 |
Quadrant C |
| Plot type | Count rate plots | Images |
|---|---|---|
| Comparison with Poisson distribution Blue bars denote a histogram of data divided into 1 sec bins. Red curve is a Poisson curve with rate = median count rate of data. |
 |
 |
| Quadrant-wise count rates Data is divided into 100 sec bins |
 |
|
| Module-wise count rates for Quadrant A Data is divided into 100 sec bins |
 |
 |
| Module-wise count rates for Quadrant B Data is divided into 100 sec bins |
 |
 |
| Module-wise count rates for Quadrant C Data is divided into 100 sec bins |
 |
 |
| Module-wise count rates for Quadrant D Data is divided into 100 sec bins |
 |
 |
| Parameter | Plot |
|---|---|
| CZT HV Monitor |  |
| D_VDD |  |
| Temperature 1 | 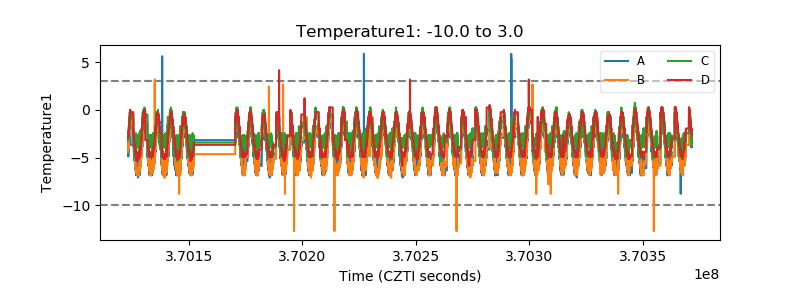 |
| Veto HV Monitor |  |
| Veto LLD |  |
| Alpha Counter |  |
| _CPM_Rate |  |
| CZT Counter |  |
| +2.5 Volts monitor |  |
| +5 Volts monitor |  |
| _ROLL_ROT | 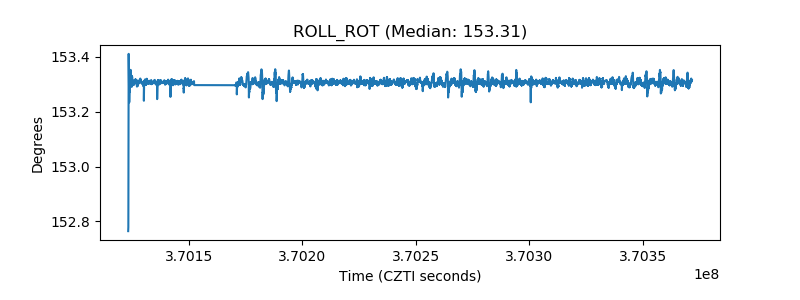 |
| _Roll_DEC |  |
| _Roll_RA |  |
| Veto Counter |  |