| Param | Original file | Final file |
|---|---|---|
| Filename | modeM0/AS1A09_131T01_9000004702cztM0_level2_bc.evt | modeM0/AS1A09_131T01_9000004702cztM0_level2_quad_clean.evt |
| Size (bytes) | 172,615,680 | 54,964,800 |
| Size | 164.6 MB | 52.4 MB |
| Events in quadrant A | 627,413 | 393,019 |
| Events in quadrant B | 2,430,580 | 336,402 |
| Events in quadrant C | 893,639 | 385,974 |
| Events in quadrant D | 1,100,145 | 371,147 |
| Mode M0 | |||
|---|---|---|---|
| Quadrant | BADHDUFLAG | Total packets | Discarded packets |
| A | 0 | 5403 | 0 |
| B | 0 | 12458 | 0 |
| C | 0 | 6705 | 0 |
| D | 0 | 7088 | 0 |
| Mode SS | |||
|---|---|---|---|
| Quadrant | BADHDUFLAG | Total packets | Discarded packets |
| A | 0 | 50 | 0 |
| B | 0 | 50 | 0 |
| C | 0 | 50 | 0 |
| D | 0 | 50 | 0 |
| Mode M9 | |||
|---|---|---|---|
| Quadrant | BADHDUFLAG | Total packets | Discarded packets |
| A | 0 | 3 | 0 |
| B | 0 | 3 | 0 |
| C | 0 | 3 | 0 |
| D | 0 | 3 | 0 |
| Quadrant | Total seconds | Saturated seconds | Saturation percentage |
|---|---|---|---|
| A | 2470 | 5 | 0.202429% |
| B | 2470 | 848 | 34.331984% |
| C | 2470 | 138 | 5.587045% |
| D | 2470 | 82 | 3.319838% |
Noise dominated data is calculated using 1-second bins in cleaned event files. If a bin has >2000 counts, and if more than 50% of those come from <1% of pixels, then it is considered to be noise-dominated and hence unusable.
| Quadrant | # 1 sec bins | Bins with >0 counts | Bins with >2000 counts | High rate bins dominated by noise | Noise dominated (total time) | Noise dominated (detector-on time) | Marked lightcurve |
|---|---|---|---|---|---|---|---|
| A | 2469 | 2469 | 0 | 0 | 0.00% | 0.00% |  |
| B | 2469 | 2468 | 8 | 8 | 0.32% | 0.32% |  |
| C | 2469 | 2469 | 6 | 6 | 0.24% | 0.24% | 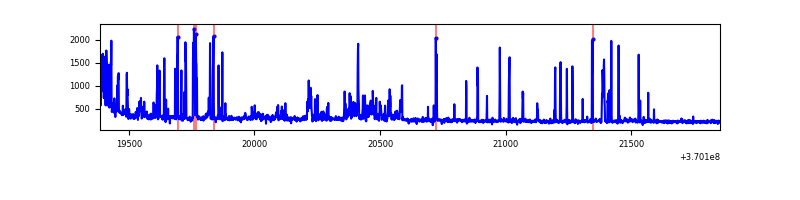 |
| D | 2469 | 2469 | 0 | 0 | 0.00% | 0.00% | 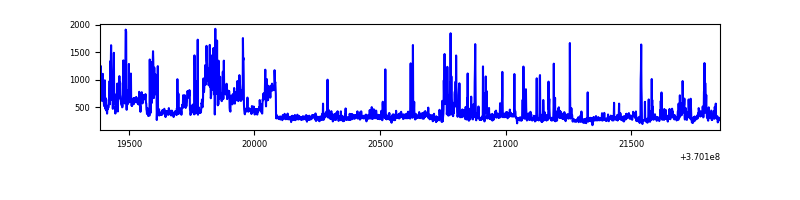 |
Top three noisy pixels from each quadrant. If the there are fewer than three noisy pixels in the level2.evt file, extra rows are filled as -1
| Pixel properties | Quadrant properties | ||||||
|---|---|---|---|---|---|---|---|
| Quadrant | DetID | PixID | Counts | Sigma | Mean | Median | Sigma |
| A | 13 | 6 | 7795 | 215.51 | 157 | 155 | 35.5 |
| A | 13 | 254 | 4717 | 128.69 | 157 | 155 | 35.5 |
| A | 0 | 6 | 4190 | 113.82 | 157 | 155 | 35.5 |
| B | 4 | 80 | 826598 | 29346.36 | 138 | 135 | 28.2 |
| B | 6 | 159 | 664429 | 23588.0 | 138 | 135 | 28.2 |
| B | 5 | 172 | 321125 | 11397.83 | 138 | 135 | 28.2 |
| C | 3 | 233 | 227872 | 5924.58 | 155 | 155 | 38.4 |
| C | 0 | 10 | 31955 | 827.35 | 155 | 155 | 38.4 |
| C | 4 | 175 | 16455 | 424.08 | 155 | 155 | 38.4 |
| D | 8 | 195 | 278009 | 7549.38 | 156 | 152 | 36.8 |
| D | 13 | 249 | 50708 | 1373.61 | 156 | 152 | 36.8 |
| D | 12 | 6 | 46005 | 1245.83 | 156 | 152 | 36.8 |
Histogram calculated using DETX and DETY for each event in the final _common_clean file
| Quadrant A | 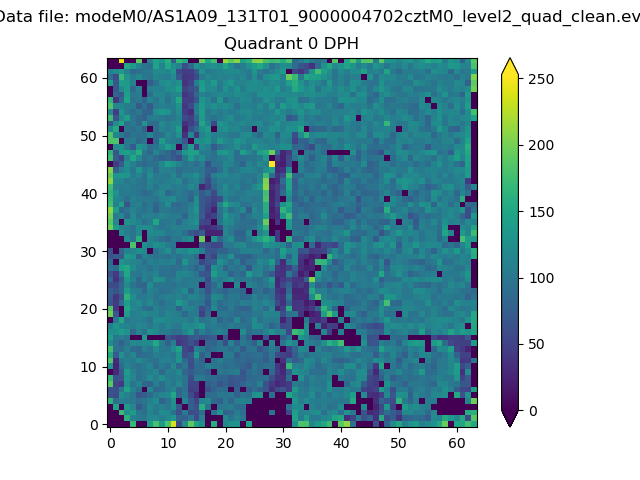 |
 |
Quadrant B |
|---|---|---|---|
| Quadrant D | 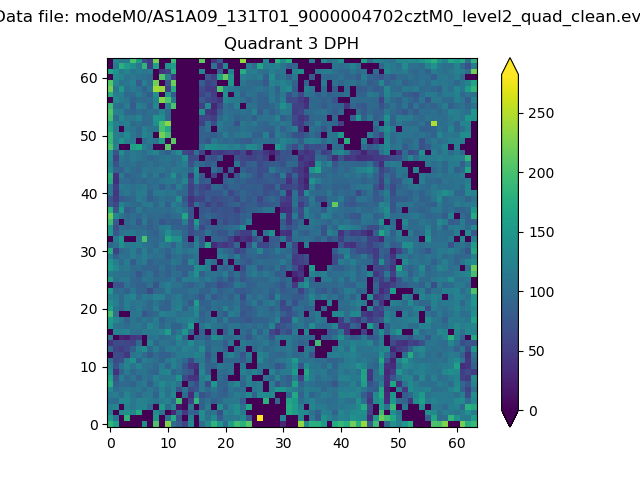 |
 |
Quadrant C |
| Plot type | Count rate plots | Images |
|---|---|---|
| Comparison with Poisson distribution Blue bars denote a histogram of data divided into 1 sec bins. Red curve is a Poisson curve with rate = median count rate of data. |
 |
 |
| Quadrant-wise count rates Data is divided into 100 sec bins |
 |
|
| Module-wise count rates for Quadrant A Data is divided into 100 sec bins |
 |
 |
| Module-wise count rates for Quadrant B Data is divided into 100 sec bins |
 |
 |
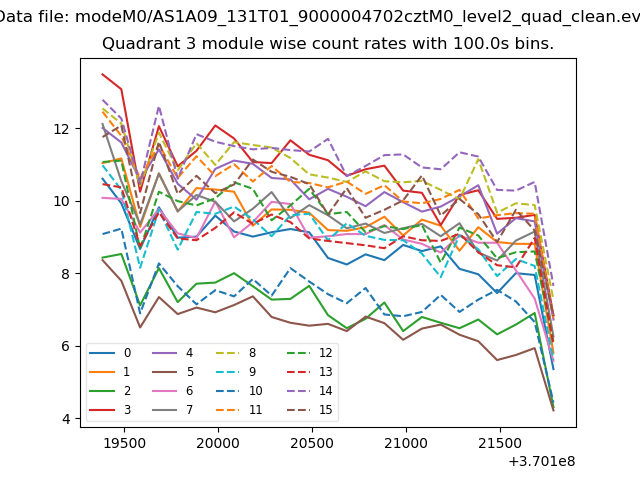
| Module-wise count rates for Quadrant C Data is divided into 100 sec bins |
 |
 |
| Module-wise count rates for Quadrant D Data is divided into 100 sec bins |
 |
 |
| Parameter | Plot |
|---|---|
| CZT HV Monitor |  |
| D_VDD |  |
| Temperature 1 | 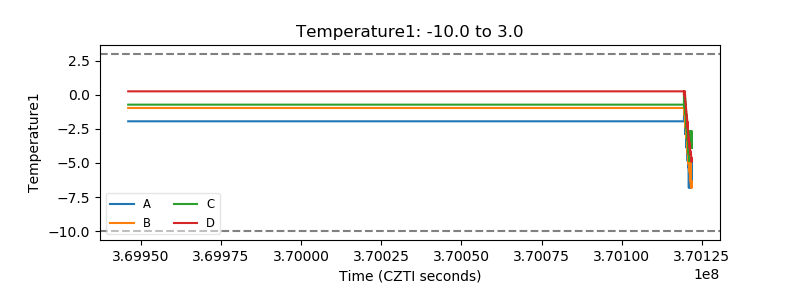 |
| Veto HV Monitor |  |
| Veto LLD |  |
| Alpha Counter |  |
| _CPM_Rate | 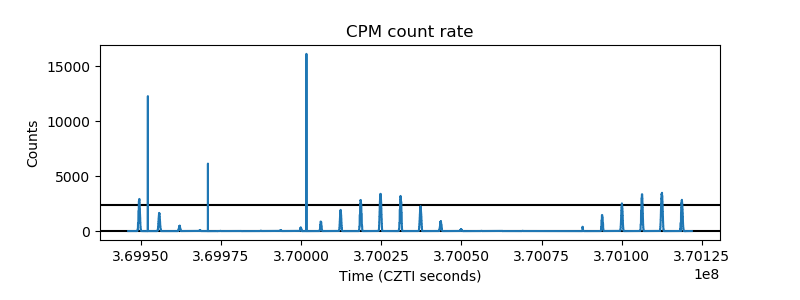 |
| CZT Counter |  |
| +2.5 Volts monitor |  |
| +5 Volts monitor | 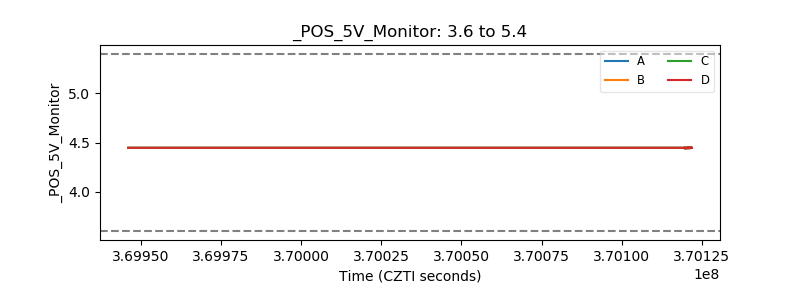 |
| _ROLL_ROT | 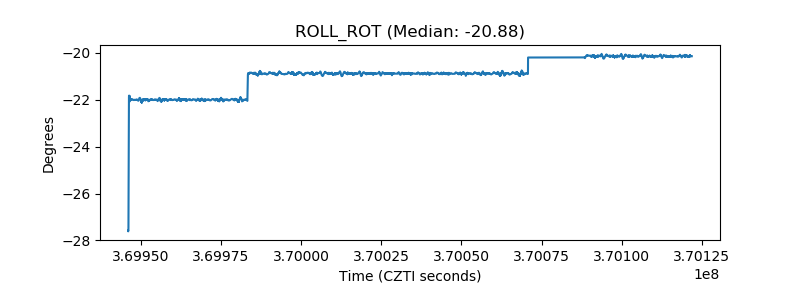 |
| _Roll_DEC |  |
| _Roll_RA |  |
| Veto Counter |  |