| Param | Original file | Final file |
|---|---|---|
| Filename | modeM0/AS1A10_053T10_9000004698cztM0_level2_bc.evt | modeM0/AS1A10_053T10_9000004698cztM0_level2_quad_clean.evt |
| Size (bytes) | 594,555,840 | 163,241,280 |
| Size | 567.0 MB | 155.7 MB |
| Events in quadrant A | 2,652,425 | 1,126,905 |
| Events in quadrant B | 6,378,771 | 1,125,404 |
| Events in quadrant C | 2,689,961 | 877,452 |
| Events in quadrant D | 5,493,979 | 1,016,555 |
| Mode M0 | |||
|---|---|---|---|
| Quadrant | BADHDUFLAG | Total packets | Discarded packets |
| A | 0 | 24825 | 0 |
| B | 0 | 37202 | 0 |
| C | 0 | 27903 | 0 |
| D | 0 | 34131 | 0 |
| Mode SS | |||
|---|---|---|---|
| Quadrant | BADHDUFLAG | Total packets | Discarded packets |
| A | 0 | 236 | 0 |
| B | 0 | 236 | 0 |
| C | 0 | 236 | 0 |
| D | 0 | 236 | 0 |
| Mode M9 | |||
|---|---|---|---|
| Quadrant | BADHDUFLAG | Total packets | Discarded packets |
| A | 0 | 36 | 0 |
| B | 0 | 36 | 0 |
| C | 0 | 36 | 0 |
| D | 0 | 36 | 0 |
| Quadrant | Total seconds | Saturated seconds | Saturation percentage |
|---|---|---|---|
| A | 11522 | 159 | 1.379969% |
| B | 11522 | 399 | 3.462940% |
| C | 11522 | 2211 | 19.189377% |
| D | 11522 | 596 | 5.172713% |
Noise dominated data is calculated using 1-second bins in cleaned event files. If a bin has >2000 counts, and if more than 50% of those come from <1% of pixels, then it is considered to be noise-dominated and hence unusable.
| Quadrant | # 1 sec bins | Bins with >0 counts | Bins with >2000 counts | High rate bins dominated by noise | Noise dominated (total time) | Noise dominated (detector-on time) | Marked lightcurve |
|---|---|---|---|---|---|---|---|
| A | 15087 | 11522 | 0 | 0 | 0.00% | 0.00% |  |
| B | 15087 | 11522 | 11 | 11 | 0.07% | 0.10% |  |
| C | 15087 | 11505 | 1 | 1 | 0.01% | 0.01% | 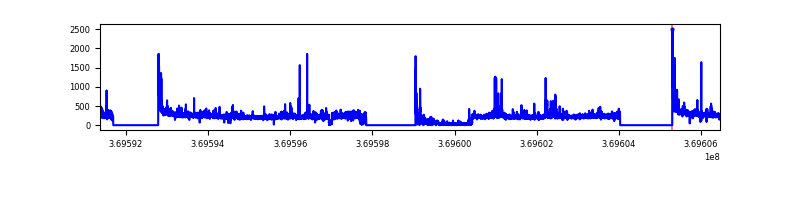 |
| D | 15087 | 11522 | 29 | 29 | 0.19% | 0.25% |  |
Top three noisy pixels from each quadrant. If the there are fewer than three noisy pixels in the level2.evt file, extra rows are filled as -1
| Pixel properties | Quadrant properties | ||||||
|---|---|---|---|---|---|---|---|
| Quadrant | DetID | PixID | Counts | Sigma | Mean | Median | Sigma |
| A | 13 | 254 | 21267 | 137.8 | 683 | 672 | 149.5 |
| A | 13 | 6 | 15484 | 99.11 | 683 | 672 | 149.5 |
| A | 0 | 226 | 4329 | 24.47 | 683 | 672 | 149.5 |
| B | 6 | 159 | 3145069 | 24000.65 | 687 | 673 | 131.0 |
| B | 0 | 190 | 193900 | 1474.87 | 687 | 673 | 131.0 |
| B | 5 | 172 | 145318 | 1104.05 | 687 | 673 | 131.0 |
| C | 3 | 233 | 158457 | 1188.26 | 556 | 556 | 132.9 |
| C | 14 | 254 | 130770 | 979.91 | 556 | 556 | 132.9 |
| C | 0 | 10 | 104347 | 781.06 | 556 | 556 | 132.9 |
| D | 8 | 195 | 1697274 | 11291.94 | 651 | 630 | 150.3 |
| D | 12 | 233 | 550393 | 3658.92 | 651 | 630 | 150.3 |
| D | 14 | 52 | 418597 | 2781.76 | 651 | 630 | 150.3 |
Histogram calculated using DETX and DETY for each event in the final _common_clean file
| Quadrant A | 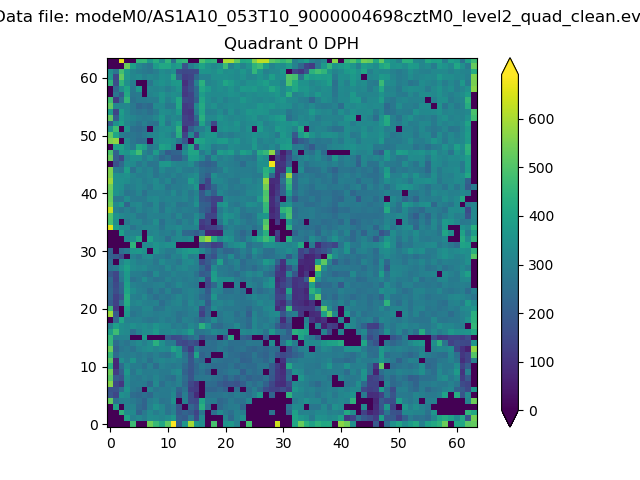 |
 |
Quadrant B |
|---|---|---|---|
| Quadrant D |  |
 |
Quadrant C |
| Plot type | Count rate plots | Images |
|---|---|---|
| Comparison with Poisson distribution Blue bars denote a histogram of data divided into 1 sec bins. Red curve is a Poisson curve with rate = median count rate of data. |
 |
 |
| Quadrant-wise count rates Data is divided into 100 sec bins |
 |
|
| Module-wise count rates for Quadrant A Data is divided into 100 sec bins |
 |
 |
| Module-wise count rates for Quadrant B Data is divided into 100 sec bins |
 |
 |
| Module-wise count rates for Quadrant C Data is divided into 100 sec bins |
 |
 |
| Module-wise count rates for Quadrant D Data is divided into 100 sec bins |
 |
 |
| Parameter | Plot |
|---|---|
| CZT HV Monitor |  |
| D_VDD |  |
| Temperature 1 |  |
| Veto HV Monitor |  |
| Veto LLD |  |
| Alpha Counter |  |
| _CPM_Rate |  |
| CZT Counter |  |
| +2.5 Volts monitor |  |
| +5 Volts monitor |  |
| _ROLL_ROT |  |
| _Roll_DEC |  |
| _Roll_RA |  |
| Veto Counter |  |