| Param | Original file | Final file |
|---|---|---|
| Filename | modeM0/AS1A10_005T01_9000004700cztM0_level2_bc.evt | modeM0/AS1A10_005T01_9000004700cztM0_level2_quad_clean.evt |
| Size (bytes) | 17,047,961,280 | 3,759,503,040 |
| Size | 15.9 GB | 3.5 GB |
| Events in quadrant A | 65,999,222 | 24,987,793 |
| Events in quadrant B | 165,871,514 | 23,740,739 |
| Events in quadrant C | 94,674,884 | 22,895,956 |
| Events in quadrant D | 169,989,344 | 22,265,156 |
| Mode M0 | |||
|---|---|---|---|
| Quadrant | BADHDUFLAG | Total packets | Discarded packets |
| A | 0 | 615450 | 0 |
| B | 0 | 975715 | 0 |
| C | 0 | 761487 | 0 |
| D | 0 | 967652 | 0 |
| Mode M9 | |||
|---|---|---|---|
| Quadrant | BADHDUFLAG | Total packets | Discarded packets |
| A | 0 | 462 | 0 |
| B | 0 | 462 | 0 |
| C | 0 | 462 | 0 |
| D | 0 | 462 | 0 |
| Mode SS | |||
|---|---|---|---|
| Quadrant | BADHDUFLAG | Total packets | Discarded packets |
| A | 0 | 5938 | 0 |
| B | 0 | 5938 | 0 |
| C | 0 | 5938 | 0 |
| D | 0 | 5938 | 0 |
| Quadrant | Total seconds | Saturated seconds | Saturation percentage |
|---|---|---|---|
| A | 291653 | 4094 | 1.403723% |
| B | 291646 | 17650 | 6.051857% |
| C | 291649 | 22216 | 7.617376% |
| D | 291652 | 17323 | 5.939613% |
Noise dominated data is calculated using 1-second bins in cleaned event files. If a bin has >2000 counts, and if more than 50% of those come from <1% of pixels, then it is considered to be noise-dominated and hence unusable.
| Quadrant | # 1 sec bins | Bins with >0 counts | Bins with >2000 counts | High rate bins dominated by noise | Noise dominated (total time) | Noise dominated (detector-on time) | Marked lightcurve |
|---|---|---|---|---|---|---|---|
| A | 337679 | 291661 | 206 | 206 | 0.06% | 0.07% | 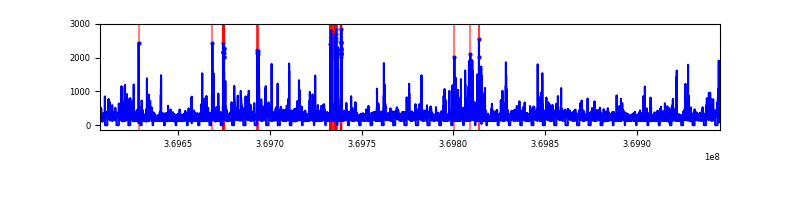 |
| B | 337679 | 291650 | 688 | 688 | 0.20% | 0.24% |  |
| C | 337679 | 291633 | 1184 | 1184 | 0.35% | 0.41% |  |
| D | 337679 | 291642 | 2306 | 2306 | 0.68% | 0.79% |  |
Top three noisy pixels from each quadrant. If the there are fewer than three noisy pixels in the level2.evt file, extra rows are filled as -1
| Pixel properties | Quadrant properties | ||||||
|---|---|---|---|---|---|---|---|
| Quadrant | DetID | PixID | Counts | Sigma | Mean | Median | Sigma |
| A | 12 | 189 | 1639059 | 479.16 | 15771 | 15546 | 3388.3 |
| A | 9 | 143 | 1374093 | 400.95 | 15771 | 15546 | 3388.3 |
| A | 13 | 6 | 728336 | 210.37 | 15771 | 15546 | 3388.3 |
| B | 6 | 159 | 81100990 | 27495.52 | 15459 | 15095 | 2949.1 |
| B | 5 | 172 | 15020758 | 5088.29 | 15459 | 15095 | 2949.1 |
| B | 0 | 190 | 3201907 | 1080.62 | 15459 | 15095 | 2949.1 |
| C | 0 | 10 | 21443363 | 6150.09 | 14723 | 14701 | 3484.3 |
| C | 3 | 233 | 9683045 | 2774.84 | 14723 | 14701 | 3484.3 |
| C | 15 | 208 | 2132503 | 607.82 | 14723 | 14701 | 3484.3 |
| D | 8 | 195 | 75110482 | 21712.0 | 15142 | 14708 | 3458.7 |
| D | 13 | 249 | 8765457 | 2530.05 | 15142 | 14708 | 3458.7 |
| D | 13 | 174 | 4722364 | 1361.1 | 15142 | 14708 | 3458.7 |
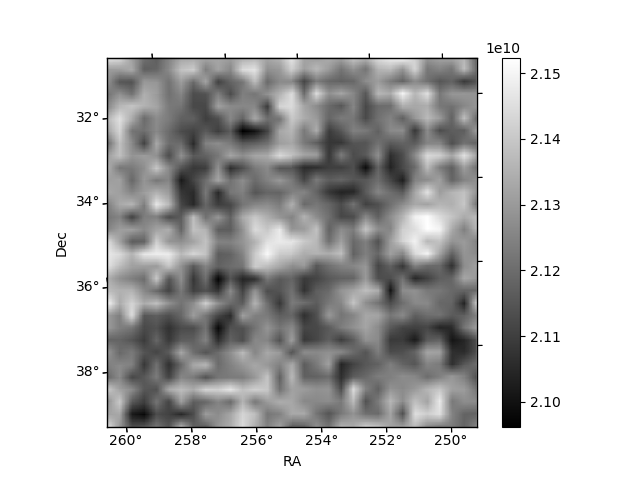
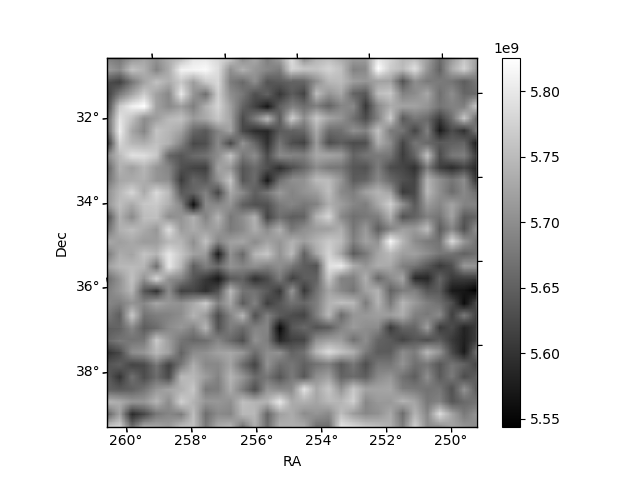
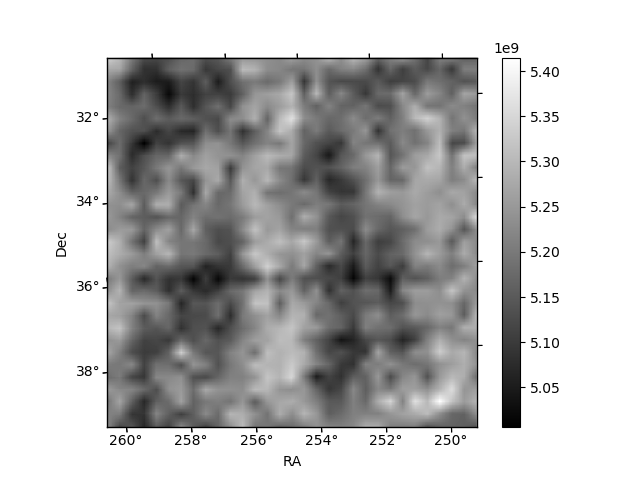
Histogram calculated using DETX and DETY for each event in the final _common_clean file
| Quadrant A |  |
 |
Quadrant B |
|---|---|---|---|
| Quadrant D |  |
 |
Quadrant C |
| Plot type | Count rate plots | Images |
|---|---|---|
| Comparison with Poisson distribution Blue bars denote a histogram of data divided into 1 sec bins. Red curve is a Poisson curve with rate = median count rate of data. |
 |
 |
| Quadrant-wise count rates Data is divided into 100 sec bins |
 |
|
| Module-wise count rates for Quadrant A Data is divided into 100 sec bins |
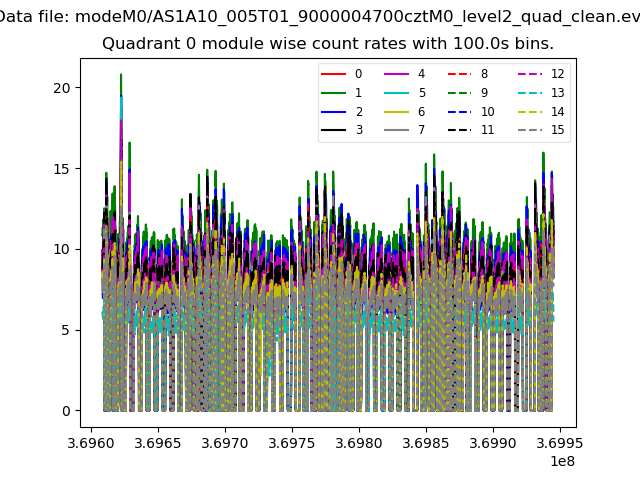 |
 |
| Module-wise count rates for Quadrant B Data is divided into 100 sec bins |
 |
 |
| Module-wise count rates for Quadrant C Data is divided into 100 sec bins |
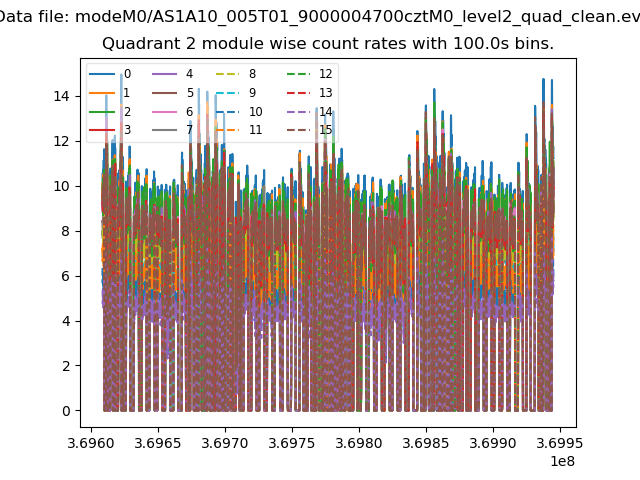 |
 |
| Module-wise count rates for Quadrant D Data is divided into 100 sec bins |
 |
 |
| Parameter | Plot |
|---|---|
| CZT HV Monitor |  |
| D_VDD |  |
| Temperature 1 |  |
| Veto HV Monitor |  |
| Veto LLD |  |
| Alpha Counter | 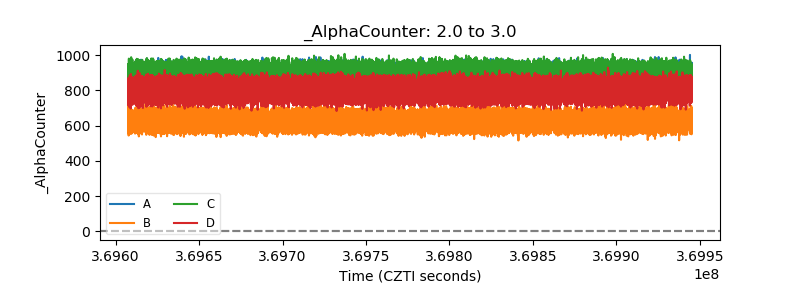 |
| _CPM_Rate |  |
| CZT Counter | 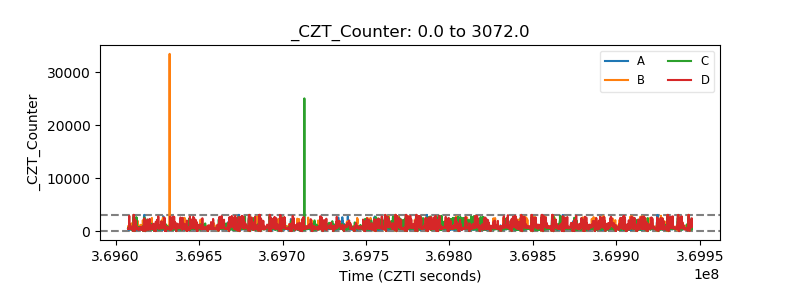 |
| +2.5 Volts monitor |  |
| +5 Volts monitor |  |
| _ROLL_ROT |  |
| _Roll_DEC |  |
| _Roll_RA |  |
| Veto Counter |  |