| Param | Original file | Final file |
|---|---|---|
| Filename | modeM0/AS1A09_131T01_9000004696cztM0_level2_bc.evt | modeM0/AS1A09_131T01_9000004696cztM0_level2_quad_clean.evt |
| Size (bytes) | 10,551,003,840 | 2,772,025,920 |
| Size | 9.8 GB | 2.6 GB |
| Events in quadrant A | 36,348,439 | 18,601,399 |
| Events in quadrant B | 94,874,846 | 18,555,329 |
| Events in quadrant C | 43,196,617 | 18,407,317 |
| Events in quadrant D | 133,514,159 | 16,666,224 |
| Mode SS | |||
|---|---|---|---|
| Quadrant | BADHDUFLAG | Total packets | Discarded packets |
| A | 0 | 3490 | 0 |
| B | 0 | 3490 | 0 |
| C | 0 | 3490 | 0 |
| D | 0 | 3490 | 0 |
| Mode M9 | |||
|---|---|---|---|
| Quadrant | BADHDUFLAG | Total packets | Discarded packets |
| A | 0 | 237 | 0 |
| B | 0 | 238 | 0 |
| C | 0 | 238 | 0 |
| D | 0 | 238 | 0 |
| Mode M0 | |||
|---|---|---|---|
| Quadrant | BADHDUFLAG | Total packets | Discarded packets |
| A | 0 | 355811 | 0 |
| B | 0 | 559561 | 0 |
| C | 0 | 384052 | 0 |
| D | 0 | 667191 | 0 |
| Quadrant | Total seconds | Saturated seconds | Saturation percentage |
|---|---|---|---|
| A | 171199 | 2076 | 1.212624% |
| B | 171199 | 8169 | 4.771640% |
| C | 171199 | 5796 | 3.385534% |
| D | 171199 | 27746 | 16.206870% |
Noise dominated data is calculated using 1-second bins in cleaned event files. If a bin has >2000 counts, and if more than 50% of those come from <1% of pixels, then it is considered to be noise-dominated and hence unusable.
| Quadrant | # 1 sec bins | Bins with >0 counts | Bins with >2000 counts | High rate bins dominated by noise | Noise dominated (total time) | Noise dominated (detector-on time) | Marked lightcurve |
|---|---|---|---|---|---|---|---|
| A | 205873 | 171206 | 9 | 9 | 0.00% | 0.01% |  |
| B | 205873 | 171202 | 201 | 201 | 0.10% | 0.12% |  |
| C | 205873 | 171186 | 251 | 251 | 0.12% | 0.15% |  |
| D | 205873 | 171195 | 14015 | 14015 | 6.81% | 8.19% |  |
Top three noisy pixels from each quadrant. If the there are fewer than three noisy pixels in the level2.evt file, extra rows are filled as -1
| Pixel properties | Quadrant properties | ||||||
|---|---|---|---|---|---|---|---|
| Quadrant | DetID | PixID | Counts | Sigma | Mean | Median | Sigma |
| A | 0 | 6 | 475127 | 235.67 | 9113 | 8961 | 1978.1 |
| A | 13 | 6 | 381885 | 188.53 | 9113 | 8961 | 1978.1 |
| A | 13 | 254 | 312608 | 153.51 | 9113 | 8961 | 1978.1 |
| B | 6 | 159 | 46784860 | 26799.83 | 9120 | 8920 | 1745.4 |
| B | 4 | 80 | 6435294 | 3681.93 | 9120 | 8920 | 1745.4 |
| B | 5 | 172 | 2296396 | 1310.59 | 9120 | 8920 | 1745.4 |
| C | 3 | 233 | 3698903 | 1761.5 | 8870 | 8861 | 2094.8 |
| C | 0 | 10 | 3552207 | 1691.48 | 8870 | 8861 | 2094.8 |
| C | 4 | 175 | 636028 | 299.39 | 8870 | 8861 | 2094.8 |
| D | 1 | 52 | 46121068 | 23533.77 | 8513 | 8259 | 1959.4 |
| D | 8 | 195 | 38668991 | 19730.58 | 8513 | 8259 | 1959.4 |
| D | 12 | 233 | 4938472 | 2516.14 | 8513 | 8259 | 1959.4 |
Histogram calculated using DETX and DETY for each event in the final _common_clean file
| Quadrant A | 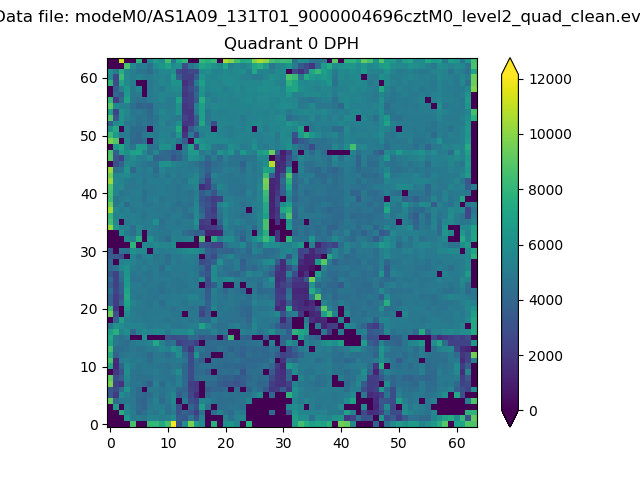 |
 |
Quadrant B |
|---|---|---|---|
| Quadrant D |  |
 |
Quadrant C |
| Plot type | Count rate plots | Images |
|---|---|---|
| Comparison with Poisson distribution Blue bars denote a histogram of data divided into 1 sec bins. Red curve is a Poisson curve with rate = median count rate of data. |
 |
 |
| Quadrant-wise count rates Data is divided into 100 sec bins |
 |
|
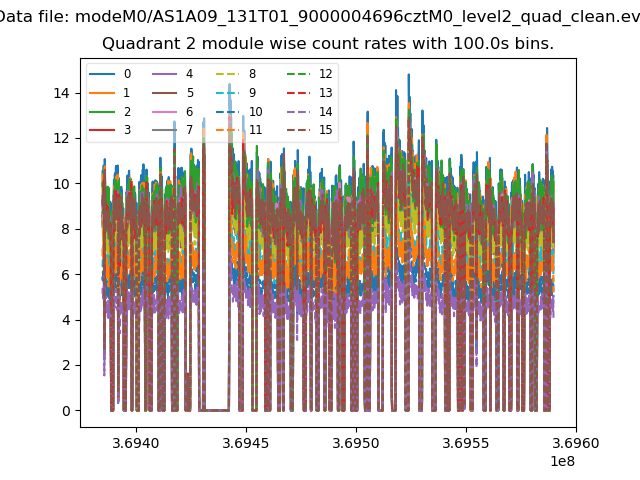
| Module-wise count rates for Quadrant A Data is divided into 100 sec bins |
 |
 |
| Module-wise count rates for Quadrant B Data is divided into 100 sec bins |
 |
 |
| Module-wise count rates for Quadrant C Data is divided into 100 sec bins |
 |
 |
| Module-wise count rates for Quadrant D Data is divided into 100 sec bins |
 |
 |
| Parameter | Plot |
|---|---|
| CZT HV Monitor |  |
| D_VDD |  |
| Temperature 1 |  |
| Veto HV Monitor |  |
| Veto LLD |  |
| Alpha Counter |  |
| _CPM_Rate |  |
| CZT Counter |  |
| +2.5 Volts monitor | 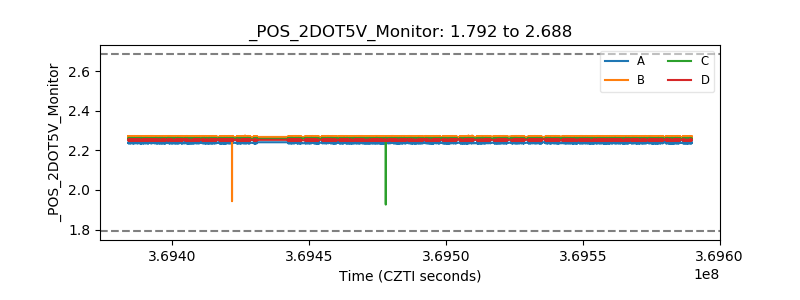 |
| +5 Volts monitor |  |
| _ROLL_ROT |  |
| _Roll_DEC |  |
| _Roll_RA |  |
| Veto Counter | 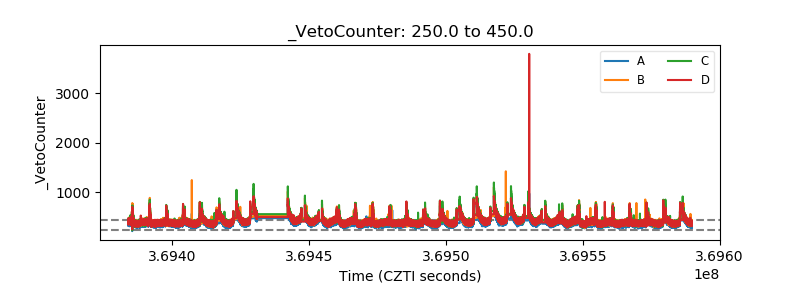 |