| Param | Original file | Final file |
|---|---|---|
| Filename | modeM0/AS1T04_054T01_9000004694cztM0_level2_bc.evt | modeM0/AS1T04_054T01_9000004694cztM0_level2_quad_clean.evt |
| Size (bytes) | 5,549,774,400 | 1,383,459,840 |
| Size | 5.2 GB | 1.3 GB |
| Events in quadrant A | 22,916,652 | 9,109,295 |
| Events in quadrant B | 58,833,290 | 8,724,661 |
| Events in quadrant C | 28,684,744 | 8,689,921 |
| Events in quadrant D | 50,633,892 | 8,303,227 |
| Mode SS | |||
|---|---|---|---|
| Quadrant | BADHDUFLAG | Total packets | Discarded packets |
| A | 0 | 2100 | 0 |
| B | 0 | 2100 | 0 |
| C | 0 | 2100 | 0 |
| D | 0 | 2100 | 0 |
| Mode M0 | |||
|---|---|---|---|
| Quadrant | BADHDUFLAG | Total packets | Discarded packets |
| A | 0 | 216423 | 0 |
| B | 0 | 350762 | 0 |
| C | 0 | 243247 | 0 |
| D | 0 | 304758 | 0 |
| Mode M9 | |||
|---|---|---|---|
| Quadrant | BADHDUFLAG | Total packets | Discarded packets |
| A | 0 | 186 | 0 |
| B | 0 | 186 | 0 |
| C | 0 | 186 | 0 |
| D | 0 | 186 | 0 |
| Quadrant | Total seconds | Saturated seconds | Saturation percentage |
|---|---|---|---|
| A | 103226 | 1315 | 1.273904% |
| B | 103226 | 8539 | 8.272141% |
| C | 103226 | 5746 | 5.566427% |
| D | 103226 | 3557 | 3.445837% |
Noise dominated data is calculated using 1-second bins in cleaned event files. If a bin has >2000 counts, and if more than 50% of those come from <1% of pixels, then it is considered to be noise-dominated and hence unusable.
| Quadrant | # 1 sec bins | Bins with >0 counts | Bins with >2000 counts | High rate bins dominated by noise | Noise dominated (total time) | Noise dominated (detector-on time) | Marked lightcurve |
|---|---|---|---|---|---|---|---|
| A | 125862 | 103233 | 6 | 6 | 0.00% | 0.01% |  |
| B | 125862 | 103223 | 210 | 210 | 0.17% | 0.20% |  |
| C | 125862 | 103213 | 55 | 55 | 0.04% | 0.05% |  |
| D | 125862 | 103230 | 326 | 326 | 0.26% | 0.32% |  |
Top three noisy pixels from each quadrant. If the there are fewer than three noisy pixels in the level2.evt file, extra rows are filled as -1
| Pixel properties | Quadrant properties | ||||||
|---|---|---|---|---|---|---|---|
| Quadrant | DetID | PixID | Counts | Sigma | Mean | Median | Sigma |
| A | 13 | 6 | 212898 | 167.09 | 5764 | 5699 | 1240.0 |
| A | 13 | 254 | 192283 | 150.47 | 5764 | 5699 | 1240.0 |
| A | 0 | 6 | 164442 | 128.01 | 5764 | 5699 | 1240.0 |
| B | 6 | 159 | 26803099 | 24989.49 | 5652 | 5546 | 1072.4 |
| B | 4 | 80 | 6459338 | 6018.35 | 5652 | 5546 | 1072.4 |
| B | 0 | 168 | 1577324 | 1465.73 | 5652 | 5546 | 1072.4 |
| C | 0 | 10 | 3357443 | 2560.58 | 5505 | 5530 | 1309.0 |
| C | 3 | 233 | 3052263 | 2327.45 | 5505 | 5530 | 1309.0 |
| C | 14 | 254 | 339873 | 255.41 | 5505 | 5530 | 1309.0 |
| D | 8 | 195 | 23230812 | 18093.61 | 5591 | 5434 | 1283.6 |
| D | 12 | 233 | 3536862 | 2751.14 | 5591 | 5434 | 1283.6 |
| D | 13 | 249 | 689394 | 532.84 | 5591 | 5434 | 1283.6 |
Histogram calculated using DETX and DETY for each event in the final _common_clean file
| Quadrant A |  |
 |
Quadrant B |
|---|---|---|---|
| Quadrant D |  |
 |
Quadrant C |
| Plot type | Count rate plots | Images |
|---|---|---|
| Comparison with Poisson distribution Blue bars denote a histogram of data divided into 1 sec bins. Red curve is a Poisson curve with rate = median count rate of data. |
 |
 |
| Quadrant-wise count rates Data is divided into 100 sec bins |
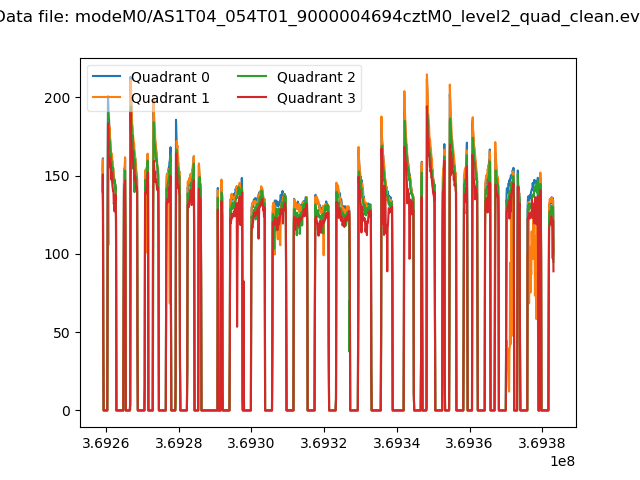 |
|
| Module-wise count rates for Quadrant A Data is divided into 100 sec bins |
 |
 |
| Module-wise count rates for Quadrant B Data is divided into 100 sec bins |
 |
 |
| Module-wise count rates for Quadrant C Data is divided into 100 sec bins |
 |
 |
| Module-wise count rates for Quadrant D Data is divided into 100 sec bins |
 |
 |
| Parameter | Plot |
|---|---|
| CZT HV Monitor |  |
| D_VDD |  |
| Temperature 1 |  |
| Veto HV Monitor |  |
| Veto LLD |  |
| Alpha Counter |  |
| _CPM_Rate |  |
| CZT Counter |  |
| +2.5 Volts monitor |  |
| +5 Volts monitor |  |
| _ROLL_ROT |  |
| _Roll_DEC |  |
| _Roll_RA | 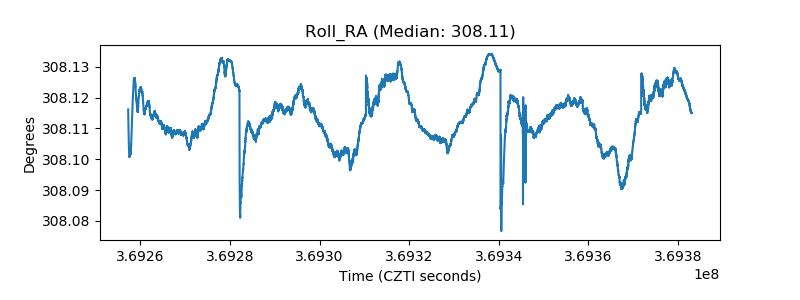 |
| Veto Counter |  |