| Param | Original file | Final file |
|---|---|---|
| Filename | modeM0/AS1A10_057T01_9000004692cztM0_level2_bc.evt | modeM0/AS1A10_057T01_9000004692cztM0_level2_quad_clean.evt |
| Size (bytes) | 8,398,428,480 | 2,196,956,160 |
| Size | 7.8 GB | 2.0 GB |
| Events in quadrant A | 35,496,379 | 14,268,386 |
| Events in quadrant B | 85,771,616 | 14,300,818 |
| Events in quadrant C | 37,854,272 | 13,482,661 |
| Events in quadrant D | 84,272,741 | 13,445,288 |
| Mode M0 | |||
|---|---|---|---|
| Quadrant | BADHDUFLAG | Total packets | Discarded packets |
| A | 0 | 339302 | 0 |
| B | 0 | 515593 | 0 |
| C | 0 | 379053 | 0 |
| D | 0 | 505600 | 0 |
| Mode SS | |||
|---|---|---|---|
| Quadrant | BADHDUFLAG | Total packets | Discarded packets |
| A | 0 | 3282 | 0 |
| B | 0 | 3282 | 0 |
| C | 0 | 3282 | 0 |
| D | 0 | 3282 | 0 |
| Mode M9 | |||
|---|---|---|---|
| Quadrant | BADHDUFLAG | Total packets | Discarded packets |
| A | 0 | 258 | 0 |
| B | 0 | 258 | 0 |
| C | 0 | 258 | 0 |
| D | 0 | 258 | 0 |
| Quadrant | Total seconds | Saturated seconds | Saturation percentage |
|---|---|---|---|
| A | 161196 | 1943 | 1.205365% |
| B | 161196 | 6425 | 3.985831% |
| C | 161196 | 21382 | 13.264597% |
| D | 161196 | 10567 | 6.555374% |
Noise dominated data is calculated using 1-second bins in cleaned event files. If a bin has >2000 counts, and if more than 50% of those come from <1% of pixels, then it is considered to be noise-dominated and hence unusable.
| Quadrant | # 1 sec bins | Bins with >0 counts | Bins with >2000 counts | High rate bins dominated by noise | Noise dominated (total time) | Noise dominated (detector-on time) | Marked lightcurve |
|---|---|---|---|---|---|---|---|
| A | 186831 | 161206 | 0 | 0 | 0.00% | 0.00% |  |
| B | 186831 | 161195 | 189 | 189 | 0.10% | 0.12% |  |
| C | 186831 | 161122 | 24 | 24 | 0.01% | 0.01% | 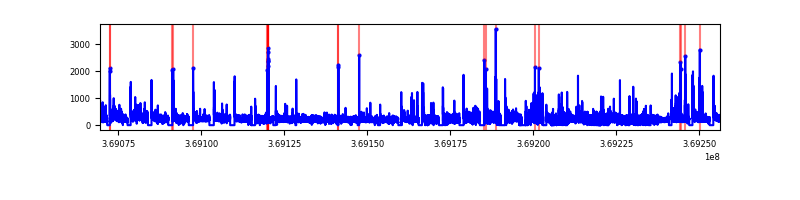 |
| D | 186831 | 161185 | 924 | 924 | 0.49% | 0.57% | 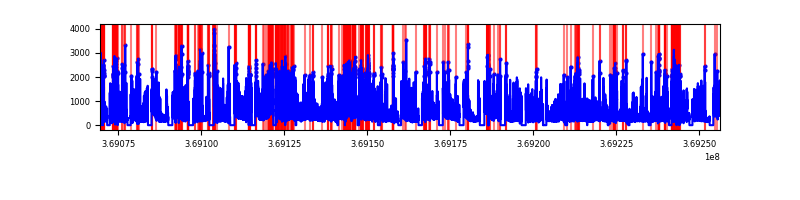 |
Top three noisy pixels from each quadrant. If the there are fewer than three noisy pixels in the level2.evt file, extra rows are filled as -1
| Pixel properties | Quadrant properties | ||||||
|---|---|---|---|---|---|---|---|
| Quadrant | DetID | PixID | Counts | Sigma | Mean | Median | Sigma |
| A | 12 | 189 | 885559 | 465.22 | 8772 | 8635 | 1885.0 |
| A | 13 | 254 | 301341 | 155.28 | 8772 | 8635 | 1885.0 |
| A | 13 | 6 | 260062 | 133.38 | 8772 | 8635 | 1885.0 |
| B | 6 | 159 | 43770356 | 26328.23 | 8786 | 8579 | 1662.2 |
| B | 5 | 172 | 3071363 | 1842.65 | 8786 | 8579 | 1662.2 |
| B | 0 | 229 | 1165533 | 696.05 | 8786 | 8579 | 1662.2 |
| C | 3 | 233 | 2263649 | 1186.84 | 8059 | 8058 | 1900.5 |
| C | 14 | 254 | 2103034 | 1102.33 | 8059 | 8058 | 1900.5 |
| C | 0 | 10 | 960960 | 501.4 | 8059 | 8058 | 1900.5 |
| D | 8 | 195 | 21694142 | 11055.13 | 8501 | 8228 | 1961.6 |
| D | 5 | 172 | 13542859 | 6899.74 | 8501 | 8228 | 1961.6 |
| D | 2 | 250 | 4742564 | 2413.49 | 8501 | 8228 | 1961.6 |
Histogram calculated using DETX and DETY for each event in the final _common_clean file
| Quadrant A |  |
 |
Quadrant B |
|---|---|---|---|
| Quadrant D |  |
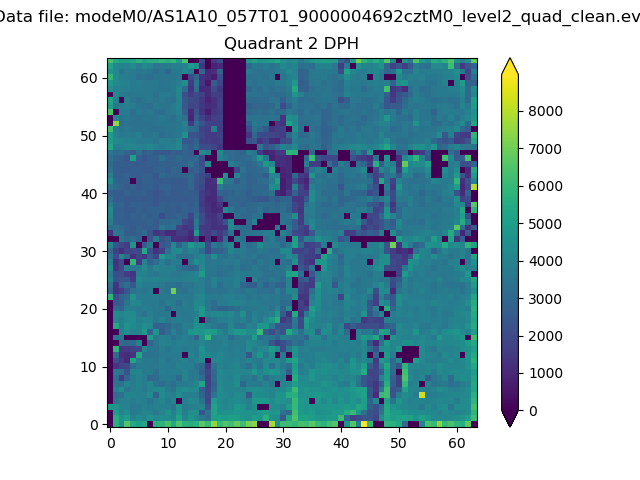 |
Quadrant C |
| Plot type | Count rate plots | Images |
|---|---|---|
| Comparison with Poisson distribution Blue bars denote a histogram of data divided into 1 sec bins. Red curve is a Poisson curve with rate = median count rate of data. |
 |
 |
| Quadrant-wise count rates Data is divided into 100 sec bins |
 |
|
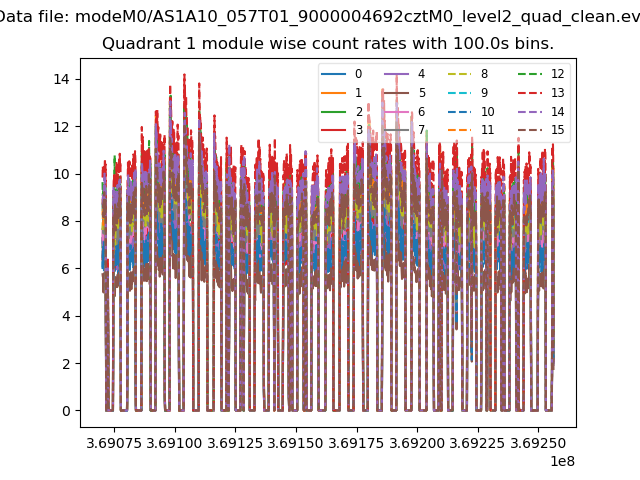
| Module-wise count rates for Quadrant A Data is divided into 100 sec bins |
 |
 |
| Module-wise count rates for Quadrant B Data is divided into 100 sec bins |
 |
 |
| Module-wise count rates for Quadrant C Data is divided into 100 sec bins |
 |
 |
| Module-wise count rates for Quadrant D Data is divided into 100 sec bins |
 |
 |
| Parameter | Plot |
|---|---|
| CZT HV Monitor |  |
| D_VDD |  |
| Temperature 1 |  |
| Veto HV Monitor |  |
| Veto LLD |  |
| Alpha Counter | 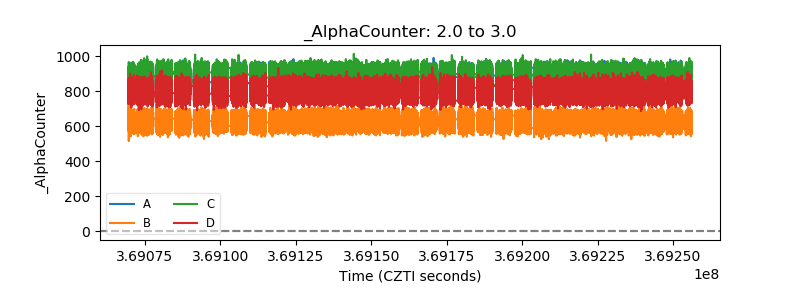 |
| _CPM_Rate |  |
| CZT Counter |  |
| +2.5 Volts monitor |  |
| +5 Volts monitor |  |
| _ROLL_ROT |  |
| _Roll_DEC |  |
| _Roll_RA |  |
| Veto Counter | 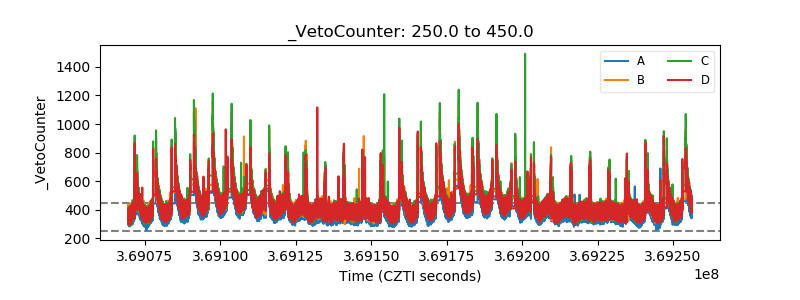 |