| Param | Original file | Final file |
|---|---|---|
| Filename | modeM0/AS1A09_131T01_9000004690cztM0_level2_bc.evt | modeM0/AS1A09_131T01_9000004690cztM0_level2_quad_clean.evt |
| Size (bytes) | 10,507,979,520 | 3,302,850,240 |
| Size | 9.8 GB | 3.1 GB |
| Events in quadrant A | 44,875,930 | 21,984,401 |
| Events in quadrant B | 110,273,960 | 21,875,977 |
| Events in quadrant C | 54,360,448 | 21,307,054 |
| Events in quadrant D | 94,739,356 | 20,766,133 |
| Mode SS | |||
|---|---|---|---|
| Quadrant | BADHDUFLAG | Total packets | Discarded packets |
| A | 0 | 4193 | 0 |
| B | 0 | 4184 | 0 |
| C | 0 | 4199 | 0 |
| D | 0 | 4194 | 0 |
| Mode M0 | |||
|---|---|---|---|
| Quadrant | BADHDUFLAG | Total packets | Discarded packets |
| A | 0 | 429753 | 0 |
| B | 0 | 658892 | 0 |
| C | 0 | 480778 | 0 |
| D | 0 | 592099 | 0 |
| Mode M9 | |||
|---|---|---|---|
| Quadrant | BADHDUFLAG | Total packets | Discarded packets |
| A | 0 | 293 | 0 |
| B | 0 | 293 | 0 |
| C | 0 | 293 | 0 |
| D | 0 | 294 | 0 |
| Quadrant | Total seconds | Saturated seconds | Saturation percentage |
|---|---|---|---|
| A | 206239 | 2358 | 1.143334% |
| B | 205567 | 8621 | 4.193767% |
| C | 206119 | 15093 | 7.322469% |
| D | 205977 | 9255 | 4.493220% |
Noise dominated data is calculated using 1-second bins in cleaned event files. If a bin has >2000 counts, and if more than 50% of those come from <1% of pixels, then it is considered to be noise-dominated and hence unusable.
| Quadrant | # 1 sec bins | Bins with >0 counts | Bins with >2000 counts | High rate bins dominated by noise | Noise dominated (total time) | Noise dominated (detector-on time) | Marked lightcurve |
|---|---|---|---|---|---|---|---|
| A | 285083 | 207248 | 13 | 13 | 0.00% | 0.01% |  |
| B | 285083 | 206545 | 446 | 446 | 0.16% | 0.22% |  |
| C | 285083 | 207013 | 277 | 277 | 0.10% | 0.13% |  |
| D | 285083 | 206937 | 530 | 530 | 0.19% | 0.26% | 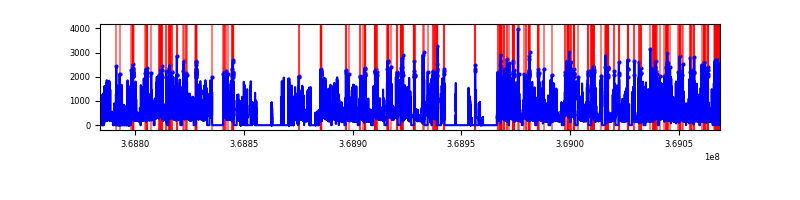 |
Top three noisy pixels from each quadrant. If the there are fewer than three noisy pixels in the level2.evt file, extra rows are filled as -1
| Pixel properties | Quadrant properties | ||||||
|---|---|---|---|---|---|---|---|
| Quadrant | DetID | PixID | Counts | Sigma | Mean | Median | Sigma |
| A | 12 | 189 | 654623 | 266.5 | 11155 | 11008 | 2415.1 |
| A | 13 | 6 | 480382 | 194.35 | 11155 | 11008 | 2415.1 |
| A | 15 | 174 | 479359 | 193.93 | 11155 | 11008 | 2415.1 |
| B | 6 | 159 | 55586956 | 26165.58 | 11130 | 10881 | 2124.0 |
| B | 5 | 172 | 4790998 | 2250.51 | 11130 | 10881 | 2124.0 |
| B | 10 | 245 | 2422970 | 1135.63 | 11130 | 10881 | 2124.0 |
| C | 0 | 10 | 5546599 | 2208.85 | 10570 | 10577 | 2506.3 |
| C | 3 | 233 | 5470682 | 2178.56 | 10570 | 10577 | 2506.3 |
| C | 14 | 254 | 1164041 | 460.23 | 10570 | 10577 | 2506.3 |
| D | 8 | 195 | 36316986 | 14484.4 | 10867 | 10549 | 2506.6 |
| D | 12 | 233 | 5230726 | 2082.58 | 10867 | 10549 | 2506.6 |
| D | 12 | 218 | 4136640 | 1646.1 | 10867 | 10549 | 2506.6 |
Histogram calculated using DETX and DETY for each event in the final _common_clean file
| Quadrant A |  |
 |
Quadrant B |
|---|---|---|---|
| Quadrant D |  |
 |
Quadrant C |
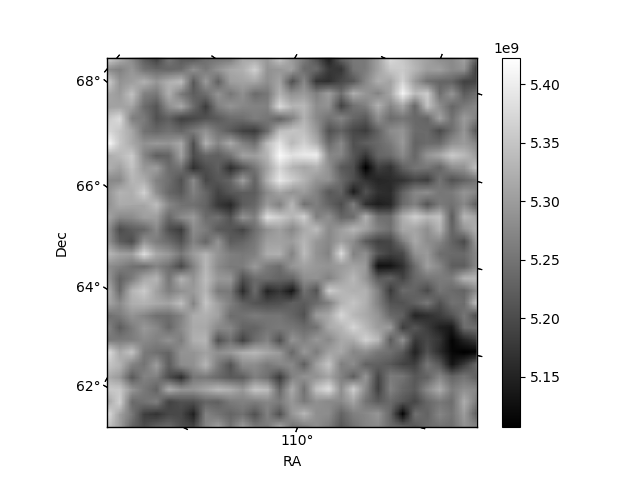
| Plot type | Count rate plots | Images |
|---|---|---|
| Comparison with Poisson distribution Blue bars denote a histogram of data divided into 1 sec bins. Red curve is a Poisson curve with rate = median count rate of data. |
 |
 |
| Quadrant-wise count rates Data is divided into 100 sec bins |
 |
|
| Module-wise count rates for Quadrant A Data is divided into 100 sec bins |
 |
 |
| Module-wise count rates for Quadrant B Data is divided into 100 sec bins |
 |
 |
| Module-wise count rates for Quadrant C Data is divided into 100 sec bins |
 |
 |
| Module-wise count rates for Quadrant D Data is divided into 100 sec bins |
 |
 |
| Parameter | Plot |
|---|---|
| CZT HV Monitor |  |
| D_VDD |  |
| Temperature 1 |  |
| Veto HV Monitor |  |
| Veto LLD | 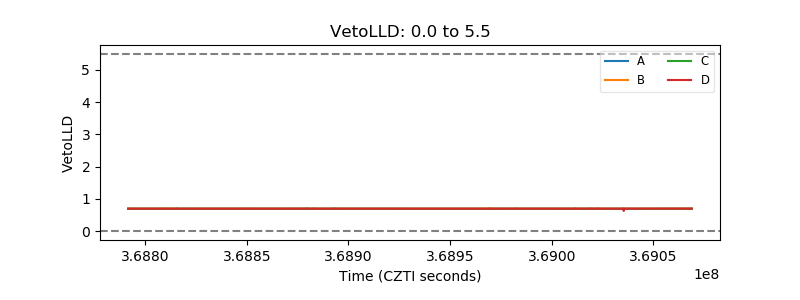 |
| Alpha Counter |  |
| _CPM_Rate |  |
| CZT Counter |  |
| +2.5 Volts monitor |  |
| +5 Volts monitor |  |
| _ROLL_ROT |  |
| _Roll_DEC |  |
| _Roll_RA |  |
| Veto Counter |  |