| Param | Original file | Final file |
|---|---|---|
| Filename | modeM0/AS1A10_053T11_9000004688cztM0_level2_bc.evt | modeM0/AS1A10_053T11_9000004688cztM0_level2_quad_clean.evt |
| Size (bytes) | 1,610,245,440 | 344,376,000 |
| Size | 1.5 GB | 328.4 MB |
| Events in quadrant A | 6,448,043 | 2,223,893 |
| Events in quadrant B | 17,733,206 | 2,100,545 |
| Events in quadrant C | 10,719,345 | 2,144,668 |
| Events in quadrant D | 12,035,202 | 2,109,192 |
| Mode M0 | |||
|---|---|---|---|
| Quadrant | BADHDUFLAG | Total packets | Discarded packets |
| A | 0 | 57072 | 0 |
| B | 0 | 96498 | 0 |
| C | 0 | 75007 | 0 |
| D | 0 | 77679 | 0 |
| Mode SS | |||
|---|---|---|---|
| Quadrant | BADHDUFLAG | Total packets | Discarded packets |
| A | 0 | 546 | 0 |
| B | 0 | 548 | 0 |
| C | 0 | 550 | 0 |
| D | 0 | 544 | 0 |
| Mode M9 | |||
|---|---|---|---|
| Quadrant | BADHDUFLAG | Total packets | Discarded packets |
| A | 0 | 65 | 0 |
| B | 0 | 65 | 0 |
| C | 0 | 65 | 0 |
| D | 0 | 65 | 0 |
| Quadrant | Total seconds | Saturated seconds | Saturation percentage |
|---|---|---|---|
| A | 26960 | 197 | 0.730712% |
| B | 26888 | 2301 | 8.557721% |
| C | 26861 | 2013 | 7.494136% |
| D | 26951 | 883 | 3.276316% |
Noise dominated data is calculated using 1-second bins in cleaned event files. If a bin has >2000 counts, and if more than 50% of those come from <1% of pixels, then it is considered to be noise-dominated and hence unusable.
| Quadrant | # 1 sec bins | Bins with >0 counts | Bins with >2000 counts | High rate bins dominated by noise | Noise dominated (total time) | Noise dominated (detector-on time) | Marked lightcurve |
|---|---|---|---|---|---|---|---|
| A | 34407 | 27051 | 0 | 0 | 0.00% | 0.00% |  |
| B | 34407 | 26991 | 312 | 312 | 0.91% | 1.16% |  |
| C | 34406 | 26961 | 170 | 170 | 0.49% | 0.63% |  |
| D | 34407 | 27059 | 21 | 21 | 0.06% | 0.08% |  |
Top three noisy pixels from each quadrant. If the there are fewer than three noisy pixels in the level2.evt file, extra rows are filled as -1
| Pixel properties | Quadrant properties | ||||||
|---|---|---|---|---|---|---|---|
| Quadrant | DetID | PixID | Counts | Sigma | Mean | Median | Sigma |
| A | 12 | 189 | 126725 | 364.2 | 1626 | 1606 | 343.5 |
| A | 13 | 254 | 46357 | 130.26 | 1626 | 1606 | 343.5 |
| A | 13 | 6 | 40100 | 112.05 | 1626 | 1606 | 343.5 |
| B | 6 | 159 | 6840057 | 23283.54 | 1598 | 1567 | 293.7 |
| B | 10 | 245 | 4333234 | 14748.36 | 1598 | 1567 | 293.7 |
| B | 0 | 190 | 189727 | 640.64 | 1598 | 1567 | 293.7 |
| C | 3 | 233 | 3917347 | 10768.58 | 1568 | 1573 | 363.6 |
| C | 0 | 10 | 552912 | 1516.21 | 1568 | 1573 | 363.6 |
| C | 14 | 254 | 49283 | 131.2 | 1568 | 1573 | 363.6 |
| D | 8 | 195 | 4312031 | 12086.73 | 1605 | 1563 | 356.6 |
| D | 12 | 233 | 1292344 | 3619.4 | 1605 | 1563 | 356.6 |
| D | 12 | 218 | 129097 | 357.61 | 1605 | 1563 | 356.6 |
Histogram calculated using DETX and DETY for each event in the final _common_clean file
| Quadrant A |  |
 |
Quadrant B |
|---|---|---|---|
| Quadrant D |  |
 |
Quadrant C |
| Plot type | Count rate plots | Images |
|---|---|---|
| Comparison with Poisson distribution Blue bars denote a histogram of data divided into 1 sec bins. Red curve is a Poisson curve with rate = median count rate of data. |
 |
 |
| Quadrant-wise count rates Data is divided into 100 sec bins |
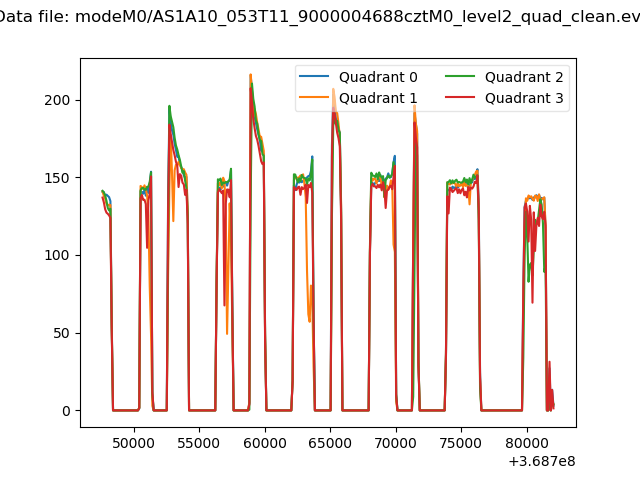 |
|
| Module-wise count rates for Quadrant A Data is divided into 100 sec bins |
 |
 |
| Module-wise count rates for Quadrant B Data is divided into 100 sec bins |
 |
 |
| Module-wise count rates for Quadrant C Data is divided into 100 sec bins |
 |
 |
| Module-wise count rates for Quadrant D Data is divided into 100 sec bins |
 |
 |
| Parameter | Plot |
|---|---|
| CZT HV Monitor |  |
| D_VDD |  |
| Temperature 1 |  |
| Veto HV Monitor |  |
| Veto LLD |  |
| Alpha Counter |  |
| _CPM_Rate | 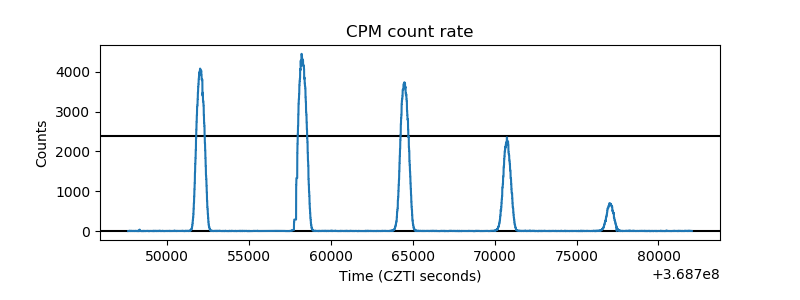 |
| CZT Counter |  |
| +2.5 Volts monitor | 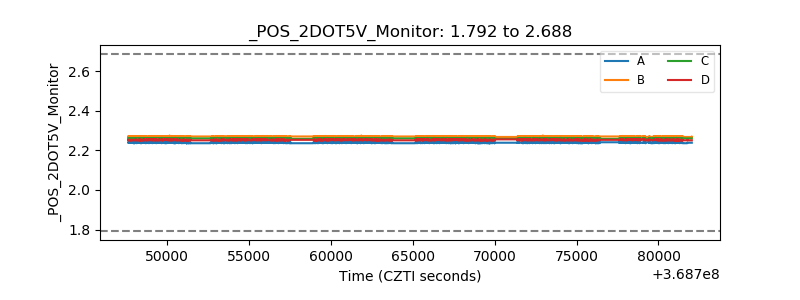 |
| +5 Volts monitor |  |
| _ROLL_ROT |  |
| _Roll_DEC |  |
| _Roll_RA |  |
| Veto Counter | 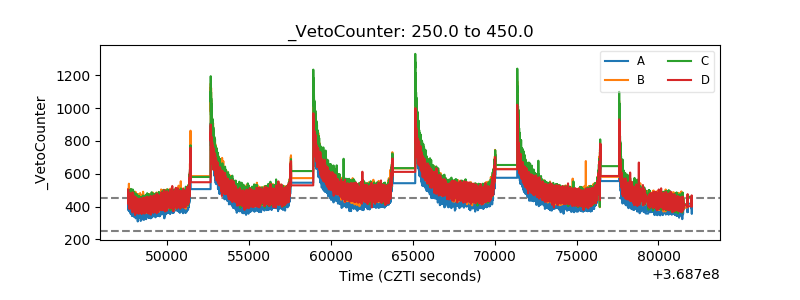 |