| Param | Original file | Final file |
|---|---|---|
| Filename | modeM0/AS1T04_051T01_9000004686cztM0_level2_bc.evt | modeM0/AS1T04_051T01_9000004686cztM0_level2_quad_clean.evt |
| Size (bytes) | 16,940,185,920 | 3,756,510,720 |
| Size | 15.8 GB | 3.5 GB |
| Events in quadrant A | 60,949,460 | 24,916,552 |
| Events in quadrant B | 199,217,322 | 23,330,968 |
| Events in quadrant C | 72,183,569 | 24,193,376 |
| Events in quadrant D | 162,211,110 | 22,651,716 |
| Mode M9 | |||
|---|---|---|---|
| Quadrant | BADHDUFLAG | Total packets | Discarded packets |
| A | 0 | 421 | 0 |
| B | 0 | 421 | 0 |
| C | 0 | 421 | 0 |
| D | 0 | 421 | 0 |
| Mode M0 | |||
|---|---|---|---|
| Quadrant | BADHDUFLAG | Total packets | Discarded packets |
| A | 0 | 570401 | 0 |
| B | 0 | 1043390 | 0 |
| C | 0 | 626552 | 0 |
| D | 0 | 918828 | 0 |
| Mode SS | |||
|---|---|---|---|
| Quadrant | BADHDUFLAG | Total packets | Discarded packets |
| A | 0 | 5546 | 0 |
| B | 0 | 5548 | 0 |
| C | 0 | 5544 | 0 |
| D | 0 | 5542 | 0 |
| Quadrant | Total seconds | Saturated seconds | Saturation percentage |
|---|---|---|---|
| A | 272749 | 2963 | 1.086347% |
| B | 272657 | 32197 | 11.808609% |
| C | 272753 | 11373 | 4.169707% |
| D | 272681 | 20773 | 7.618059% |
Noise dominated data is calculated using 1-second bins in cleaned event files. If a bin has >2000 counts, and if more than 50% of those come from <1% of pixels, then it is considered to be noise-dominated and hence unusable.
| Quadrant | # 1 sec bins | Bins with >0 counts | Bins with >2000 counts | High rate bins dominated by noise | Noise dominated (total time) | Noise dominated (detector-on time) | Marked lightcurve |
|---|---|---|---|---|---|---|---|
| A | 336485 | 272898 | 1 | 1 | 0.00% | 0.00% |  |
| B | 336485 | 272812 | 4262 | 4262 | 1.27% | 1.56% |  |
| C | 336485 | 272885 | 608 | 608 | 0.18% | 0.22% |  |
| D | 336485 | 272837 | 5087 | 5087 | 1.51% | 1.86% |  |
Top three noisy pixels from each quadrant. If the there are fewer than three noisy pixels in the level2.evt file, extra rows are filled as -1
| Pixel properties | Quadrant properties | ||||||
|---|---|---|---|---|---|---|---|
| Quadrant | DetID | PixID | Counts | Sigma | Mean | Median | Sigma |
| A | 13 | 6 | 592733 | 174.26 | 15522 | 15316 | 3313.5 |
| A | 13 | 254 | 514950 | 150.79 | 15522 | 15316 | 3313.5 |
| A | 15 | 174 | 154553 | 42.02 | 15522 | 15316 | 3313.5 |
| B | 6 | 159 | 71877589 | 25553.31 | 14967 | 14659 | 2812.3 |
| B | 10 | 245 | 57686864 | 20507.31 | 14967 | 14659 | 2812.3 |
| B | 5 | 172 | 4928726 | 1747.36 | 14967 | 14659 | 2812.3 |
| C | 0 | 10 | 12064741 | 3466.58 | 14860 | 14892 | 3476.0 |
| C | 4 | 175 | 709483 | 199.82 | 14860 | 14892 | 3476.0 |
| C | 3 | 233 | 573322 | 160.65 | 14860 | 14892 | 3476.0 |
| D | 8 | 195 | 58381398 | 17013.55 | 14900 | 14448 | 3430.6 |
| D | 12 | 79 | 17244837 | 5022.54 | 14900 | 14448 | 3430.6 |
| D | 12 | 233 | 10603077 | 3086.51 | 14900 | 14448 | 3430.6 |
Histogram calculated using DETX and DETY for each event in the final _common_clean file
| Quadrant A |  |
 |
Quadrant B |
|---|---|---|---|
| Quadrant D | 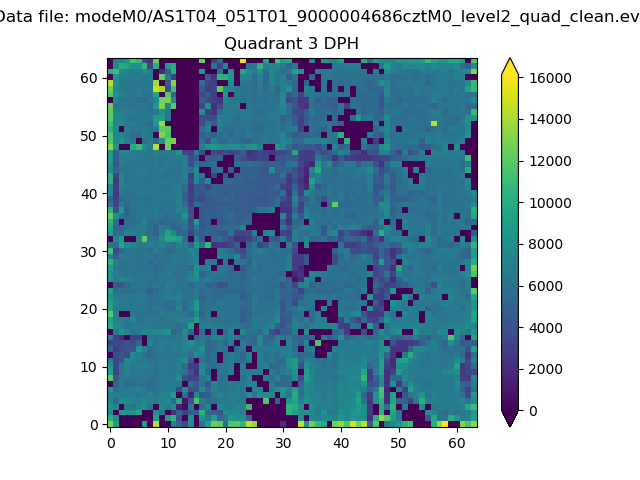 |
 |
Quadrant C |
| Plot type | Count rate plots | Images |
|---|---|---|
| Comparison with Poisson distribution Blue bars denote a histogram of data divided into 1 sec bins. Red curve is a Poisson curve with rate = median count rate of data. |
 |
 |
| Quadrant-wise count rates Data is divided into 100 sec bins |
 |
|
| Module-wise count rates for Quadrant A Data is divided into 100 sec bins |
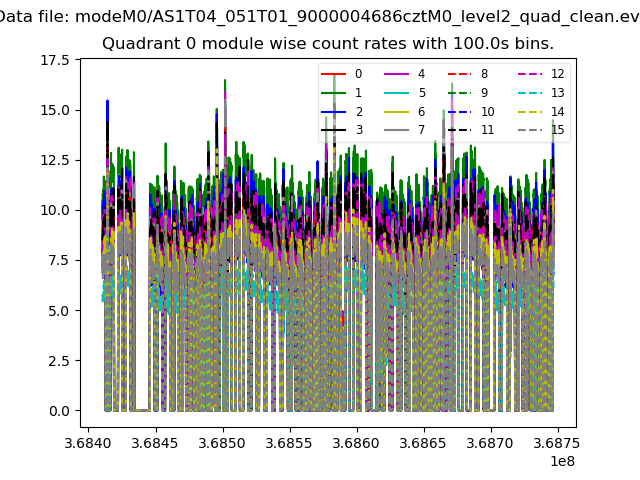 |
 |
| Module-wise count rates for Quadrant B Data is divided into 100 sec bins |
 |
 |
| Module-wise count rates for Quadrant C Data is divided into 100 sec bins |
 |
 |
| Module-wise count rates for Quadrant D Data is divided into 100 sec bins |
 |
 |
| Parameter | Plot |
|---|---|
| CZT HV Monitor |  |
| D_VDD |  |
| Temperature 1 |  |
| Veto HV Monitor |  |
| Veto LLD |  |
| Alpha Counter | 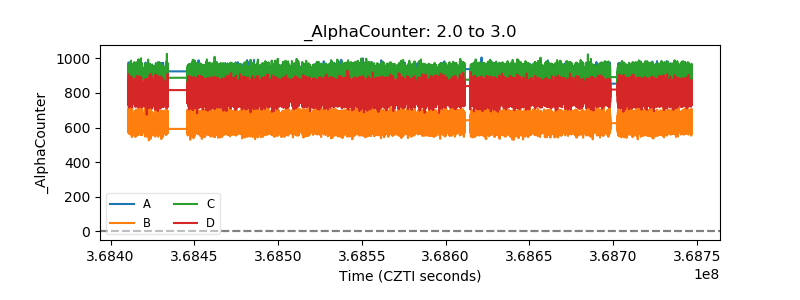 |
| _CPM_Rate |  |
| CZT Counter | 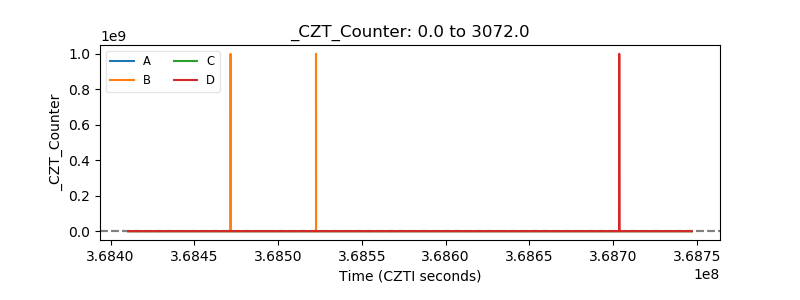 |
| +2.5 Volts monitor |  |
| +5 Volts monitor |  |
| _ROLL_ROT |  |
| _Roll_DEC |  |
| _Roll_RA |  |
| Veto Counter |  |