| Param | Original file | Final file |
|---|---|---|
| Filename | modeM0/AS1T04_046T01_9000004680cztM0_level2_bc.evt | modeM0/AS1T04_046T01_9000004680cztM0_level2_quad_clean.evt |
| Size (bytes) | 6,833,888,640 | 1,851,739,200 |
| Size | 6.4 GB | 1.7 GB |
| Events in quadrant A | 28,624,005 | 12,308,852 |
| Events in quadrant B | 69,414,170 | 11,942,924 |
| Events in quadrant C | 38,605,543 | 11,839,492 |
| Events in quadrant D | 61,733,244 | 11,323,399 |
| Mode M0 | |||
|---|---|---|---|
| Quadrant | BADHDUFLAG | Total packets | Discarded packets |
| A | 0 | 266266 | 0 |
| B | 0 | 412230 | 0 |
| C | 0 | 313542 | 0 |
| D | 0 | 370094 | 0 |
| Mode M9 | |||
|---|---|---|---|
| Quadrant | BADHDUFLAG | Total packets | Discarded packets |
| A | 0 | 199 | 0 |
| B | 0 | 199 | 0 |
| C | 0 | 199 | 0 |
| D | 0 | 200 | 0 |
| Mode SS | |||
|---|---|---|---|
| Quadrant | BADHDUFLAG | Total packets | Discarded packets |
| A | 0 | 2576 | 0 |
| B | 0 | 2578 | 0 |
| C | 0 | 2576 | 0 |
| D | 0 | 2576 | 0 |
| Quadrant | Total seconds | Saturated seconds | Saturation percentage |
|---|---|---|---|
| A | 126617 | 1280 | 1.010923% |
| B | 126562 | 6386 | 5.045748% |
| C | 126621 | 5654 | 4.465294% |
| D | 126583 | 7291 | 5.759857% |
Noise dominated data is calculated using 1-second bins in cleaned event files. If a bin has >2000 counts, and if more than 50% of those come from <1% of pixels, then it is considered to be noise-dominated and hence unusable.
| Quadrant | # 1 sec bins | Bins with >0 counts | Bins with >2000 counts | High rate bins dominated by noise | Noise dominated (total time) | Noise dominated (detector-on time) | Marked lightcurve |
|---|---|---|---|---|---|---|---|
| A | 150662 | 126680 | 5 | 5 | 0.00% | 0.00% |  |
| B | 150662 | 126631 | 94 | 94 | 0.06% | 0.07% |  |
| C | 150662 | 126689 | 177 | 177 | 0.12% | 0.14% | 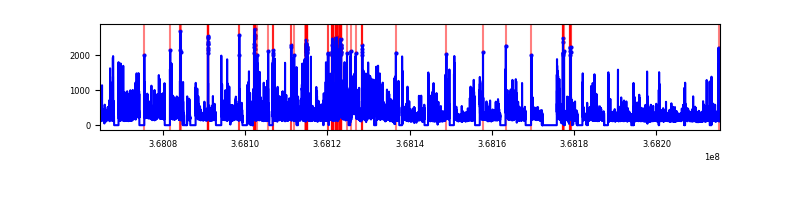 |
| D | 150662 | 126651 | 3682 | 3682 | 2.44% | 2.91% |  |
Top three noisy pixels from each quadrant. If the there are fewer than three noisy pixels in the level2.evt file, extra rows are filled as -1
| Pixel properties | Quadrant properties | ||||||
|---|---|---|---|---|---|---|---|
| Quadrant | DetID | PixID | Counts | Sigma | Mean | Median | Sigma |
| A | 13 | 254 | 235463 | 146.03 | 7280 | 7177 | 1563.3 |
| A | 13 | 6 | 230424 | 142.81 | 7280 | 7177 | 1563.3 |
| A | 15 | 174 | 151824 | 92.53 | 7280 | 7177 | 1563.3 |
| B | 6 | 159 | 33449682 | 24837.87 | 7129 | 6984 | 1346.4 |
| B | 12 | 18 | 2721008 | 2015.7 | 7129 | 6984 | 1346.4 |
| B | 5 | 172 | 2367633 | 1753.25 | 7129 | 6984 | 1346.4 |
| C | 3 | 233 | 8046067 | 4960.72 | 6911 | 6924 | 1620.6 |
| C | 0 | 10 | 2783620 | 1713.42 | 6911 | 6924 | 1620.6 |
| C | 2 | 114 | 241507 | 144.75 | 6911 | 6924 | 1620.6 |
| D | 8 | 195 | 16320848 | 10270.11 | 7006 | 6825 | 1588.5 |
| D | 12 | 227 | 11488958 | 7228.31 | 7006 | 6825 | 1588.5 |
| D | 2 | 250 | 2876908 | 1806.79 | 7006 | 6825 | 1588.5 |
Histogram calculated using DETX and DETY for each event in the final _common_clean file
| Quadrant A |  |
 |
Quadrant B |
|---|---|---|---|
| Quadrant D |  |
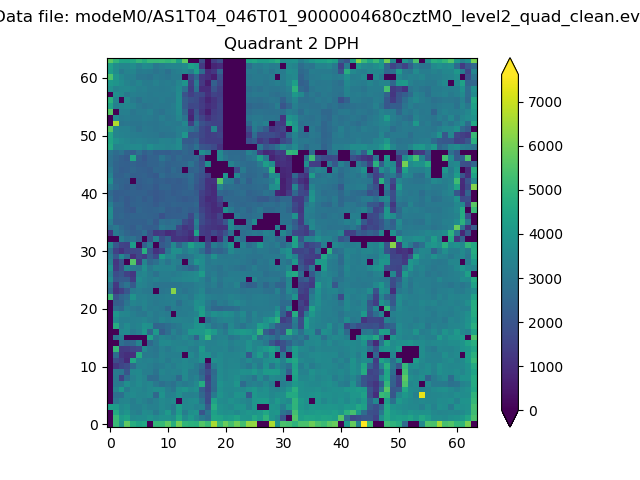 |
Quadrant C |
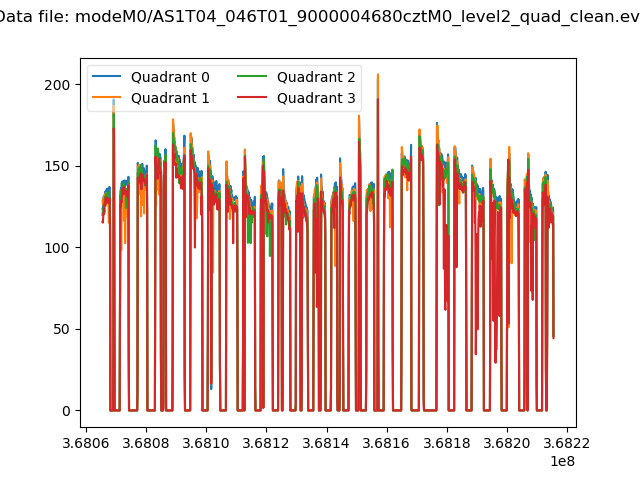
| Plot type | Count rate plots | Images |
|---|---|---|
| Comparison with Poisson distribution Blue bars denote a histogram of data divided into 1 sec bins. Red curve is a Poisson curve with rate = median count rate of data. |
 |
 |
| Quadrant-wise count rates Data is divided into 100 sec bins |
 |
|
| Module-wise count rates for Quadrant A Data is divided into 100 sec bins |
 |
 |
| Module-wise count rates for Quadrant B Data is divided into 100 sec bins |
 |
 |
| Module-wise count rates for Quadrant C Data is divided into 100 sec bins |
 |
 |
| Module-wise count rates for Quadrant D Data is divided into 100 sec bins |
 |
 |
| Parameter | Plot |
|---|---|
| CZT HV Monitor |  |
| D_VDD |  |
| Temperature 1 |  |
| Veto HV Monitor |  |
| Veto LLD |  |
| Alpha Counter |  |
| _CPM_Rate |  |
| CZT Counter | 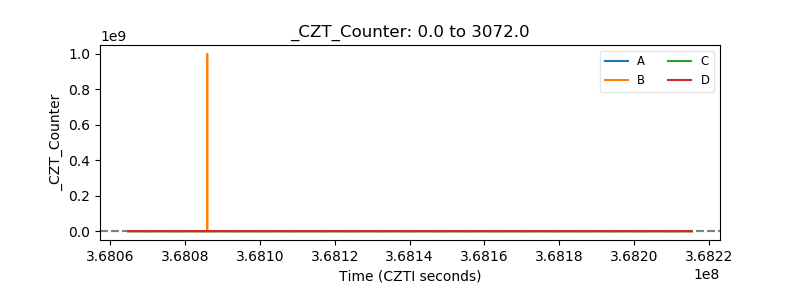 |
| +2.5 Volts monitor |  |
| +5 Volts monitor |  |
| _ROLL_ROT | 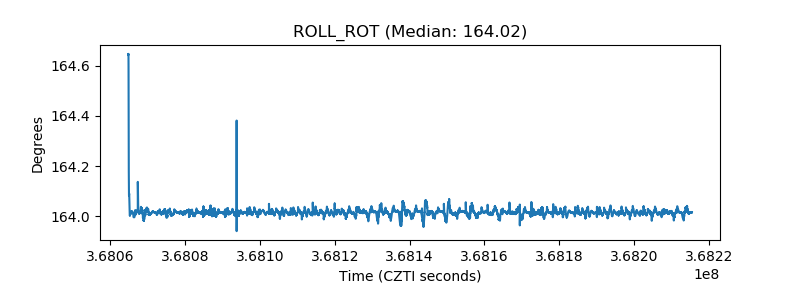 |
| _Roll_DEC |  |
| _Roll_RA |  |
| Veto Counter |  |