| Param | Original file | Final file |
|---|---|---|
| Filename | modeM0/AS1C06_010T03_9000004676cztM0_level2_bc.evt | modeM0/AS1C06_010T03_9000004676cztM0_level2_quad_clean.evt |
| Size (bytes) | 2,937,692,160 | 1,178,743,680 |
| Size | 2.7 GB | 1.1 GB |
| Events in quadrant A | 12,956,749 | 8,249,368 |
| Events in quadrant B | 31,533,375 | 8,081,781 |
| Events in quadrant C | 19,313,678 | 7,689,702 |
| Events in quadrant D | 21,124,476 | 7,608,276 |
| Mode SS | |||
|---|---|---|---|
| Quadrant | BADHDUFLAG | Total packets | Discarded packets |
| A | 0 | 1212 | 0 |
| B | 0 | 1212 | 0 |
| C | 0 | 1212 | 0 |
| D | 0 | 1212 | 0 |
| Mode M0 | |||
|---|---|---|---|
| Quadrant | BADHDUFLAG | Total packets | Discarded packets |
| A | 0 | 122535 | 0 |
| B | 0 | 188915 | 0 |
| C | 0 | 149234 | 0 |
| D | 0 | 152556 | 0 |
| Mode M9 | |||
|---|---|---|---|
| Quadrant | BADHDUFLAG | Total packets | Discarded packets |
| A | 0 | 102 | 0 |
| B | 0 | 102 | 0 |
| C | 0 | 102 | 0 |
| D | 0 | 102 | 0 |
| Quadrant | Total seconds | Saturated seconds | Saturation percentage |
|---|---|---|---|
| A | 59438 | 381 | 0.641004% |
| B | 59438 | 2164 | 3.640769% |
| C | 59438 | 2228 | 3.748444% |
| D | 59438 | 2216 | 3.728255% |
Noise dominated data is calculated using 1-second bins in cleaned event files. If a bin has >2000 counts, and if more than 50% of those come from <1% of pixels, then it is considered to be noise-dominated and hence unusable.
| Quadrant | # 1 sec bins | Bins with >0 counts | Bins with >2000 counts | High rate bins dominated by noise | Noise dominated (total time) | Noise dominated (detector-on time) | Marked lightcurve |
|---|---|---|---|---|---|---|---|
| A | 69743 | 59431 | 0 | 0 | 0.00% | 0.00% |  |
| B | 69743 | 59428 | 32 | 32 | 0.05% | 0.05% |  |
| C | 69742 | 59429 | 30 | 30 | 0.04% | 0.05% |  |
| D | 69743 | 59430 | 115 | 115 | 0.16% | 0.19% |  |
Top three noisy pixels from each quadrant. If the there are fewer than three noisy pixels in the level2.evt file, extra rows are filled as -1
| Pixel properties | Quadrant properties | ||||||
|---|---|---|---|---|---|---|---|
| Quadrant | DetID | PixID | Counts | Sigma | Mean | Median | Sigma |
| A | 13 | 254 | 103015 | 138.94 | 3305 | 3259 | 718.0 |
| A | 13 | 6 | 100222 | 135.05 | 3305 | 3259 | 718.0 |
| A | 15 | 174 | 89587 | 120.24 | 3305 | 3259 | 718.0 |
| B | 6 | 159 | 15743426 | 25125.58 | 3257 | 3181 | 626.5 |
| B | 10 | 245 | 1347938 | 2146.59 | 3257 | 3181 | 626.5 |
| B | 5 | 172 | 961397 | 1529.56 | 3257 | 3181 | 626.5 |
| C | 3 | 233 | 5082883 | 6941.31 | 3070 | 3065 | 731.8 |
| C | 0 | 10 | 1637393 | 2233.23 | 3070 | 3065 | 731.8 |
| C | 0 | 207 | 233010 | 314.21 | 3070 | 3065 | 731.8 |
| D | 8 | 195 | 4145544 | 5743.69 | 3173 | 3086 | 721.2 |
| D | 13 | 249 | 2139010 | 2961.55 | 3173 | 3086 | 721.2 |
| D | 12 | 218 | 833532 | 1151.45 | 3173 | 3086 | 721.2 |
Histogram calculated using DETX and DETY for each event in the final _common_clean file
| Quadrant A |  |
 |
Quadrant B |
|---|---|---|---|
| Quadrant D |  |
 |
Quadrant C |
| Plot type | Count rate plots | Images |
|---|---|---|
| Comparison with Poisson distribution Blue bars denote a histogram of data divided into 1 sec bins. Red curve is a Poisson curve with rate = median count rate of data. |
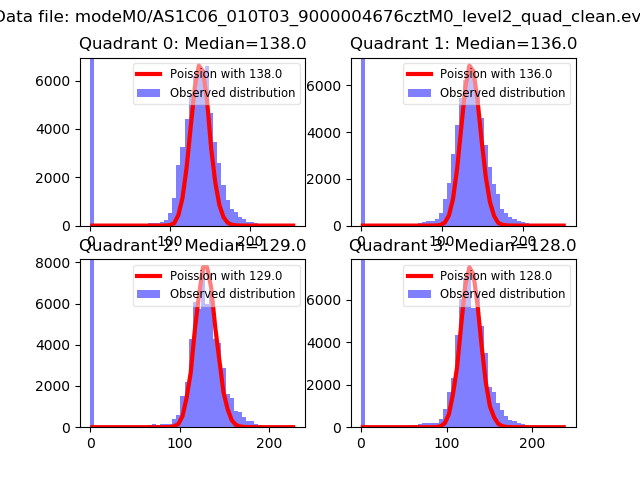 |
 |
| Quadrant-wise count rates Data is divided into 100 sec bins |
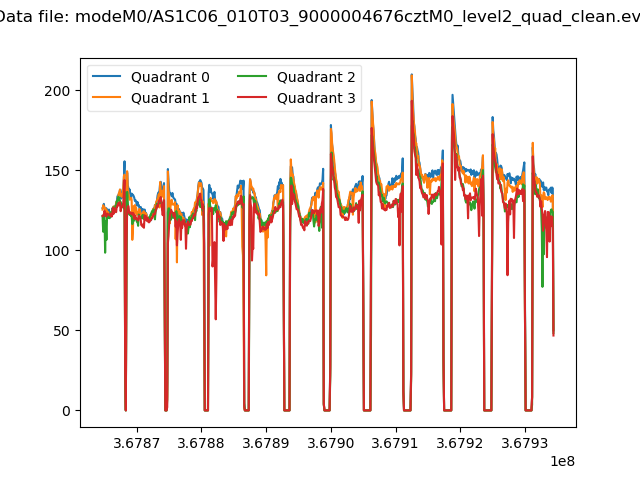 |
|
| Module-wise count rates for Quadrant A Data is divided into 100 sec bins |
 |
 |
| Module-wise count rates for Quadrant B Data is divided into 100 sec bins |
 |
 |
| Module-wise count rates for Quadrant C Data is divided into 100 sec bins |
 |
 |
| Module-wise count rates for Quadrant D Data is divided into 100 sec bins |
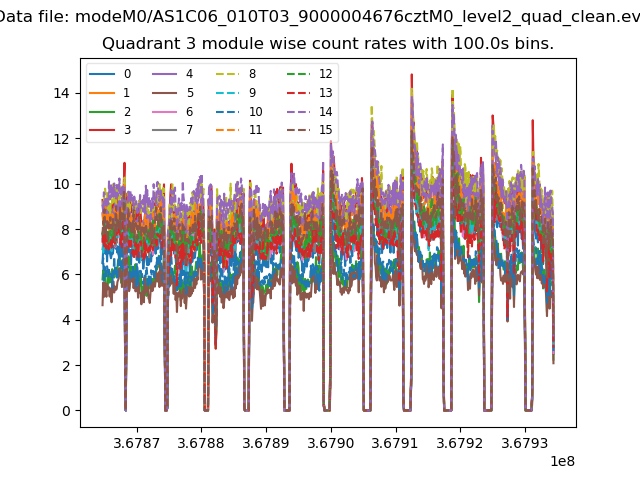 |
 |
| Parameter | Plot |
|---|---|
| CZT HV Monitor | 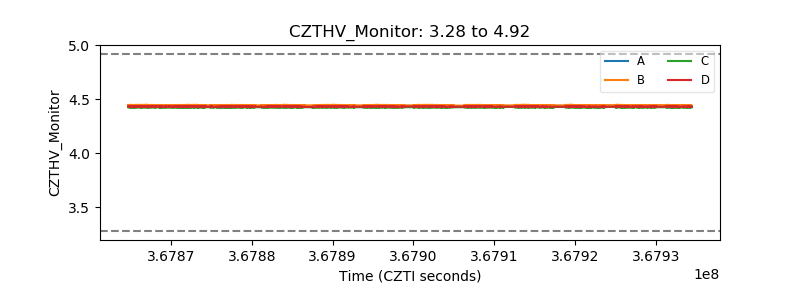 |
| D_VDD |  |
| Temperature 1 |  |
| Veto HV Monitor | 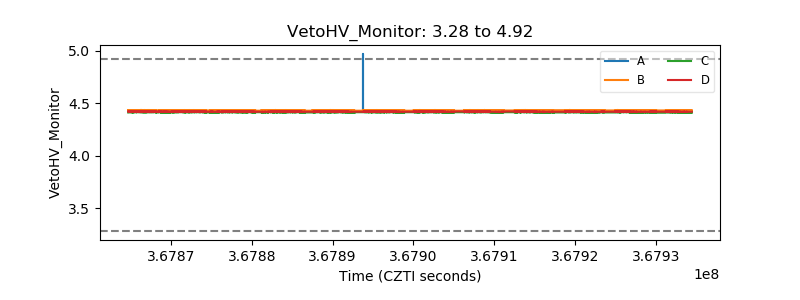 |
| Veto LLD |  |
| Alpha Counter |  |
| _CPM_Rate |  |
| CZT Counter | 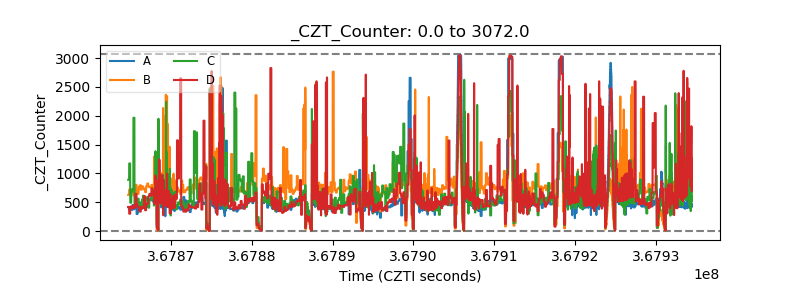 |
| +2.5 Volts monitor |  |
| +5 Volts monitor |  |
| _ROLL_ROT |  |
| _Roll_DEC | 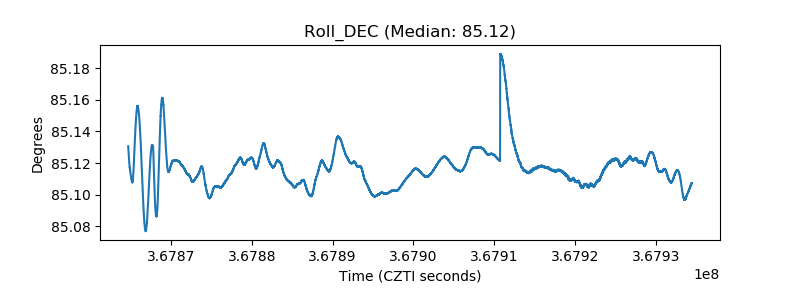 |
| _Roll_RA |  |
| Veto Counter |  |