| Param | Original file | Final file |
|---|---|---|
| Filename | modeM0/AS1A10_058T12_9000004674cztM0_level2_bc.evt | modeM0/AS1A10_058T12_9000004674cztM0_level2_quad_clean.evt |
| Size (bytes) | 3,660,770,880 | 1,011,974,400 |
| Size | 3.4 GB | 965.1 MB |
| Events in quadrant A | 17,436,377 | 6,516,353 |
| Events in quadrant B | 39,533,606 | 6,425,046 |
| Events in quadrant C | 22,440,038 | 6,157,823 |
| Events in quadrant D | 26,024,336 | 6,074,027 |
| Mode SS | |||
|---|---|---|---|
| Quadrant | BADHDUFLAG | Total packets | Discarded packets |
| A | 0 | 1628 | 0 |
| B | 0 | 1628 | 0 |
| C | 0 | 1628 | 0 |
| D | 0 | 1628 | 0 |
| Mode M0 | |||
|---|---|---|---|
| Quadrant | BADHDUFLAG | Total packets | Discarded packets |
| A | 0 | 167124 | 0 |
| B | 0 | 246561 | 0 |
| C | 0 | 190798 | 0 |
| D | 0 | 196901 | 0 |
| Mode M9 | |||
|---|---|---|---|
| Quadrant | BADHDUFLAG | Total packets | Discarded packets |
| A | 0 | 123 | 0 |
| B | 0 | 123 | 0 |
| C | 0 | 123 | 0 |
| D | 0 | 123 | 0 |
| Quadrant | Total seconds | Saturated seconds | Saturation percentage |
|---|---|---|---|
| A | 79909 | 868 | 1.086236% |
| B | 79909 | 2262 | 2.830720% |
| C | 79909 | 3313 | 4.145966% |
| D | 79909 | 2427 | 3.037205% |
Noise dominated data is calculated using 1-second bins in cleaned event files. If a bin has >2000 counts, and if more than 50% of those come from <1% of pixels, then it is considered to be noise-dominated and hence unusable.
| Quadrant | # 1 sec bins | Bins with >0 counts | Bins with >2000 counts | High rate bins dominated by noise | Noise dominated (total time) | Noise dominated (detector-on time) | Marked lightcurve |
|---|---|---|---|---|---|---|---|
| A | 92159 | 79900 | 0 | 0 | 0.00% | 0.00% |  |
| B | 92159 | 79894 | 49 | 49 | 0.05% | 0.06% |  |
| C | 92159 | 79894 | 363 | 363 | 0.39% | 0.45% |  |
| D | 92159 | 79897 | 144 | 144 | 0.16% | 0.18% | 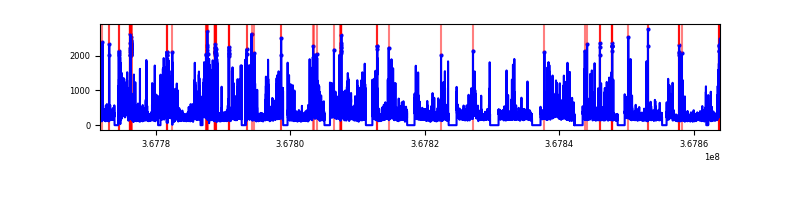 |
Top three noisy pixels from each quadrant. If the there are fewer than three noisy pixels in the level2.evt file, extra rows are filled as -1
| Pixel properties | Quadrant properties | ||||||
|---|---|---|---|---|---|---|---|
| Quadrant | DetID | PixID | Counts | Sigma | Mean | Median | Sigma |
| A | 13 | 254 | 139980 | 140.41 | 4481 | 4409 | 965.6 |
| A | 13 | 6 | 75269 | 73.39 | 4481 | 4409 | 965.6 |
| A | 14 | 238 | 52624 | 49.93 | 4481 | 4409 | 965.6 |
| B | 6 | 159 | 20343799 | 24153.19 | 4428 | 4320 | 842.1 |
| B | 10 | 245 | 1087884 | 1286.73 | 4428 | 4320 | 842.1 |
| B | 0 | 190 | 287553 | 336.34 | 4428 | 4320 | 842.1 |
| C | 3 | 233 | 3015754 | 3073.94 | 4179 | 4172 | 979.7 |
| C | 0 | 10 | 1968883 | 2005.39 | 4179 | 4172 | 979.7 |
| C | 10 | 22 | 473867 | 479.42 | 4179 | 4172 | 979.7 |
| D | 8 | 195 | 4472366 | 4555.8 | 4331 | 4202 | 980.8 |
| D | 2 | 250 | 1682248 | 1710.96 | 4331 | 4202 | 980.8 |
| D | 13 | 249 | 887776 | 900.9 | 4331 | 4202 | 980.8 |
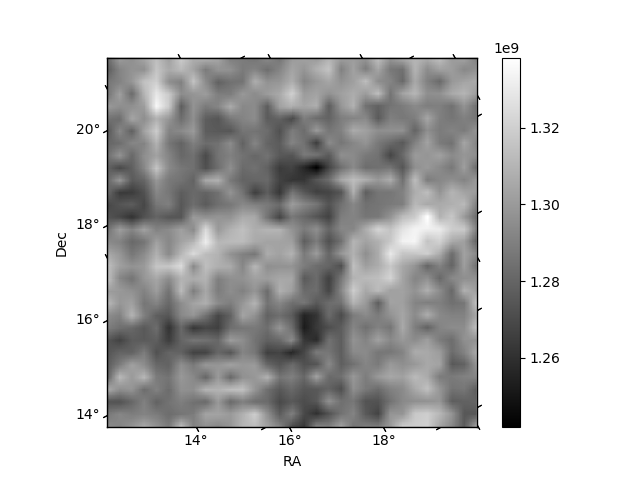
Histogram calculated using DETX and DETY for each event in the final _common_clean file
| Quadrant A |  |
 |
Quadrant B |
|---|---|---|---|
| Quadrant D |  |
 |
Quadrant C |
| Plot type | Count rate plots | Images |
|---|---|---|
| Comparison with Poisson distribution Blue bars denote a histogram of data divided into 1 sec bins. Red curve is a Poisson curve with rate = median count rate of data. |
 |
 |
| Quadrant-wise count rates Data is divided into 100 sec bins |
 |
|
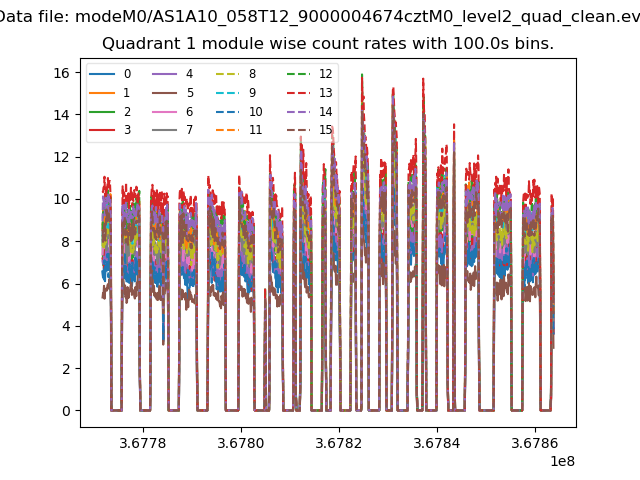
| Module-wise count rates for Quadrant A Data is divided into 100 sec bins |
 |
 |
| Module-wise count rates for Quadrant B Data is divided into 100 sec bins |
 |
 |
| Module-wise count rates for Quadrant C Data is divided into 100 sec bins |
 |
 |
| Module-wise count rates for Quadrant D Data is divided into 100 sec bins |
 |
 |
| Parameter | Plot |
|---|---|
| CZT HV Monitor |  |
| D_VDD |  |
| Temperature 1 |  |
| Veto HV Monitor |  |
| Veto LLD |  |
| Alpha Counter |  |
| _CPM_Rate | 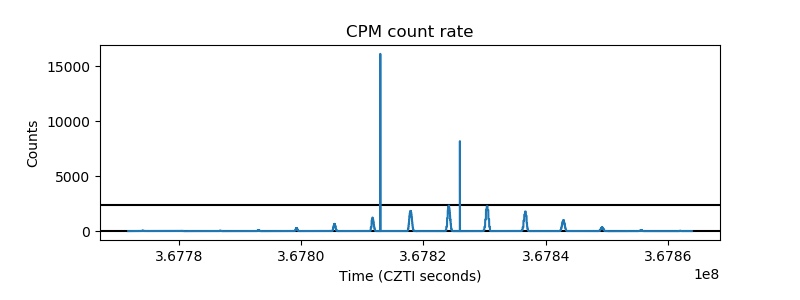 |
| CZT Counter |  |
| +2.5 Volts monitor |  |
| +5 Volts monitor |  |
| _ROLL_ROT | 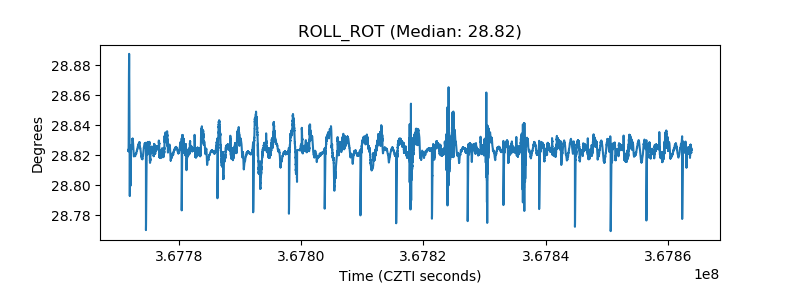 |
| _Roll_DEC |  |
| _Roll_RA |  |
| Veto Counter |  |