| Param | Original file | Final file |
|---|---|---|
| Filename | modeM0/AS1A10_094T34_9000004662cztM0_level2_bc.evt | modeM0/AS1A10_094T34_9000004662cztM0_level2_quad_clean.evt |
| Size (bytes) | 887,100,480 | 270,141,120 |
| Size | 846.0 MB | 257.6 MB |
| Events in quadrant A | 3,859,105 | 1,818,333 |
| Events in quadrant B | 8,534,459 | 1,805,400 |
| Events in quadrant C | 6,686,495 | 1,730,307 |
| Events in quadrant D | 6,670,716 | 1,701,486 |
| Mode M0 | |||
|---|---|---|---|
| Quadrant | BADHDUFLAG | Total packets | Discarded packets |
| A | 0 | 34462 | 0 |
| B | 0 | 50908 | 0 |
| C | 0 | 47077 | 0 |
| D | 0 | 45839 | 0 |
| Mode M9 | |||
|---|---|---|---|
| Quadrant | BADHDUFLAG | Total packets | Discarded packets |
| A | 0 | 36 | 0 |
| B | 0 | 36 | 0 |
| C | 0 | 36 | 0 |
| D | 0 | 36 | 0 |
| Mode SS | |||
|---|---|---|---|
| Quadrant | BADHDUFLAG | Total packets | Discarded packets |
| A | 0 | 332 | 0 |
| B | 0 | 332 | 0 |
| C | 0 | 332 | 0 |
| D | 0 | 332 | 0 |
| Quadrant | Total seconds | Saturated seconds | Saturation percentage |
|---|---|---|---|
| A | 16333 | 127 | 0.777567% |
| B | 16333 | 385 | 2.357191% |
| C | 16333 | 1052 | 6.440948% |
| D | 16333 | 918 | 5.620523% |
Noise dominated data is calculated using 1-second bins in cleaned event files. If a bin has >2000 counts, and if more than 50% of those come from <1% of pixels, then it is considered to be noise-dominated and hence unusable.
| Quadrant | # 1 sec bins | Bins with >0 counts | Bins with >2000 counts | High rate bins dominated by noise | Noise dominated (total time) | Noise dominated (detector-on time) | Marked lightcurve |
|---|---|---|---|---|---|---|---|
| A | 19898 | 16330 | 0 | 0 | 0.00% | 0.00% |  |
| B | 19898 | 16330 | 10 | 10 | 0.05% | 0.06% |  |
| C | 19898 | 16331 | 14 | 14 | 0.07% | 0.09% |  |
| D | 19898 | 16329 | 28 | 28 | 0.14% | 0.17% |  |
Top three noisy pixels from each quadrant. If the there are fewer than three noisy pixels in the level2.evt file, extra rows are filled as -1
| Pixel properties | Quadrant properties | ||||||
|---|---|---|---|---|---|---|---|
| Quadrant | DetID | PixID | Counts | Sigma | Mean | Median | Sigma |
| A | 13 | 254 | 29979 | 138.99 | 987 | 975 | 208.7 |
| A | 14 | 238 | 19098 | 86.85 | 987 | 975 | 208.7 |
| A | 13 | 6 | 16565 | 74.71 | 987 | 975 | 208.7 |
| B | 6 | 159 | 4248536 | 23080.88 | 976 | 960 | 184.0 |
| B | 5 | 172 | 209930 | 1135.52 | 976 | 960 | 184.0 |
| B | 0 | 190 | 123314 | 664.86 | 976 | 960 | 184.0 |
| C | 3 | 233 | 1801141 | 7987.09 | 940 | 941 | 225.4 |
| C | 0 | 10 | 1136289 | 5037.29 | 940 | 941 | 225.4 |
| C | 14 | 254 | 37300 | 161.32 | 940 | 941 | 225.4 |
| D | 13 | 249 | 1397844 | 6237.98 | 969 | 944 | 223.9 |
| D | 8 | 195 | 726970 | 3242.14 | 969 | 944 | 223.9 |
| D | 12 | 218 | 423100 | 1885.18 | 969 | 944 | 223.9 |
Histogram calculated using DETX and DETY for each event in the final _common_clean file
| Quadrant A |  |
 |
Quadrant B |
|---|---|---|---|
| Quadrant D |  |
 |
Quadrant C |
| Plot type | Count rate plots | Images |
|---|---|---|
| Comparison with Poisson distribution Blue bars denote a histogram of data divided into 1 sec bins. Red curve is a Poisson curve with rate = median count rate of data. |
 |
 |
| Quadrant-wise count rates Data is divided into 100 sec bins |
 |
|
| Module-wise count rates for Quadrant A Data is divided into 100 sec bins |
 |
 |
| Module-wise count rates for Quadrant B Data is divided into 100 sec bins |
 |
 |
| Module-wise count rates for Quadrant C Data is divided into 100 sec bins |
 |
 |
| Module-wise count rates for Quadrant D Data is divided into 100 sec bins |
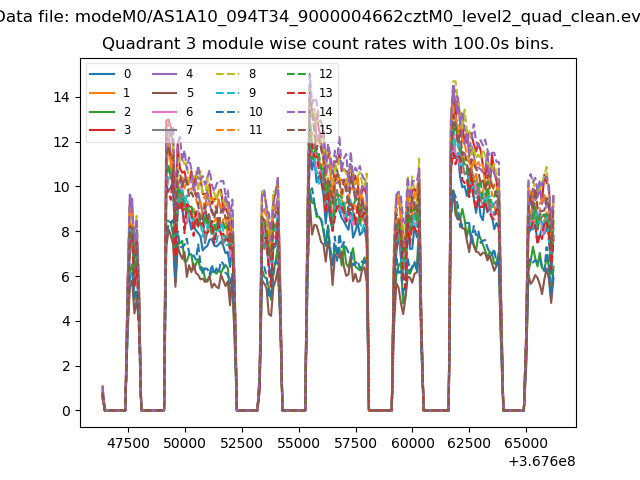 |
 |
| Parameter | Plot |
|---|---|
| CZT HV Monitor |  |
| D_VDD |  |
| Temperature 1 |  |
| Veto HV Monitor |  |
| Veto LLD |  |
| Alpha Counter |  |
| _CPM_Rate |  |
| CZT Counter |  |
| +2.5 Volts monitor |  |
| +5 Volts monitor |  |
| _ROLL_ROT |  |
| _Roll_DEC | 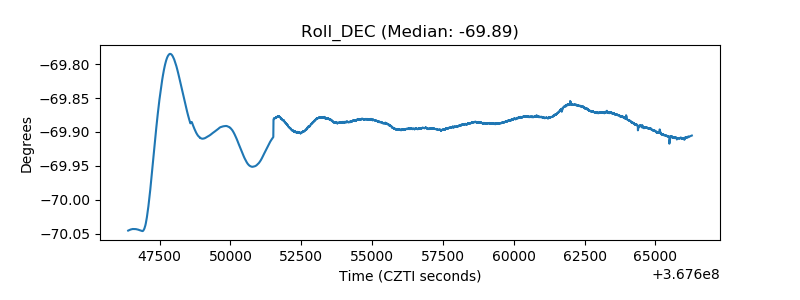 |
| _Roll_RA |  |
| Veto Counter |  |