| Param | Original file | Final file |
|---|---|---|
| Filename | modeM0/AS1A10_094T33_9000004664cztM0_level2_bc.evt | modeM0/AS1A10_094T33_9000004664cztM0_level2_quad_clean.evt |
| Size (bytes) | 250,122,240 | 82,946,880 |
| Size | 238.5 MB | 79.1 MB |
| Events in quadrant A | 1,149,972 | 563,177 |
| Events in quadrant B | 2,482,140 | 553,893 |
| Events in quadrant C | 1,416,469 | 534,364 |
| Events in quadrant D | 2,201,167 | 531,939 |
| Mode M9 | |||
|---|---|---|---|
| Quadrant | BADHDUFLAG | Total packets | Discarded packets |
| A | 0 | 13 | 0 |
| B | 0 | 13 | 0 |
| C | 0 | 13 | 0 |
| D | 0 | 13 | 0 |
| Mode SS | |||
|---|---|---|---|
| Quadrant | BADHDUFLAG | Total packets | Discarded packets |
| A | 0 | 96 | 0 |
| B | 0 | 96 | 0 |
| C | 0 | 96 | 0 |
| D | 0 | 96 | 0 |
| Mode M0 | |||
|---|---|---|---|
| Quadrant | BADHDUFLAG | Total packets | Discarded packets |
| A | 0 | 9936 | 0 |
| B | 0 | 14454 | 0 |
| C | 0 | 11184 | 0 |
| D | 0 | 13822 | 0 |
| Quadrant | Total seconds | Saturated seconds | Saturation percentage |
|---|---|---|---|
| A | 4676 | 31 | 0.662960% |
| B | 4676 | 81 | 1.732250% |
| C | 4676 | 157 | 3.357571% |
| D | 4675 | 93 | 1.989305% |
Noise dominated data is calculated using 1-second bins in cleaned event files. If a bin has >2000 counts, and if more than 50% of those come from <1% of pixels, then it is considered to be noise-dominated and hence unusable.
| Quadrant | # 1 sec bins | Bins with >0 counts | Bins with >2000 counts | High rate bins dominated by noise | Noise dominated (total time) | Noise dominated (detector-on time) | Marked lightcurve |
|---|---|---|---|---|---|---|---|
| A | 5981 | 4675 | 0 | 0 | 0.00% | 0.00% | 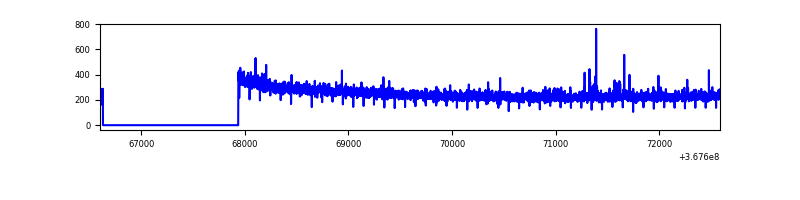 |
| B | 5981 | 4675 | 4 | 4 | 0.07% | 0.09% |  |
| C | 5981 | 4675 | 10 | 10 | 0.17% | 0.21% | 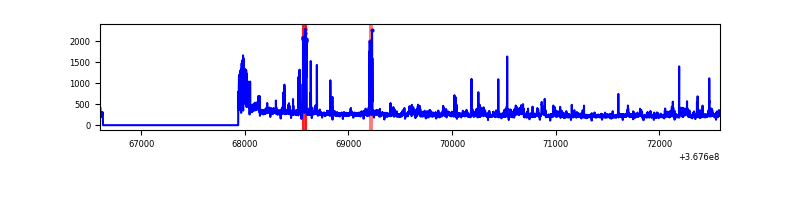 |
| D | 5981 | 4675 | 14 | 14 | 0.23% | 0.30% |  |
Top three noisy pixels from each quadrant. If the there are fewer than three noisy pixels in the level2.evt file, extra rows are filled as -1
| Pixel properties | Quadrant properties | ||||||
|---|---|---|---|---|---|---|---|
| Quadrant | DetID | PixID | Counts | Sigma | Mean | Median | Sigma |
| A | 14 | 238 | 11340 | 173.07 | 293 | 289 | 63.9 |
| A | 13 | 254 | 8762 | 132.7 | 293 | 289 | 63.9 |
| A | 13 | 6 | 5886 | 87.66 | 293 | 289 | 63.9 |
| B | 6 | 159 | 1252856 | 22631.94 | 287 | 283 | 55.3 |
| B | 5 | 172 | 51873 | 932.15 | 287 | 283 | 55.3 |
| B | 0 | 190 | 17101 | 303.87 | 287 | 283 | 55.3 |
| C | 0 | 10 | 215000 | 3222.88 | 277 | 278 | 66.6 |
| C | 3 | 233 | 116240 | 1740.54 | 277 | 278 | 66.6 |
| C | 4 | 175 | 9173 | 133.51 | 277 | 278 | 66.6 |
| D | 8 | 195 | 803150 | 11792.16 | 288 | 279 | 68.1 |
| D | 13 | 249 | 179247 | 2628.59 | 288 | 279 | 68.1 |
| D | 2 | 250 | 37287 | 543.55 | 288 | 279 | 68.1 |
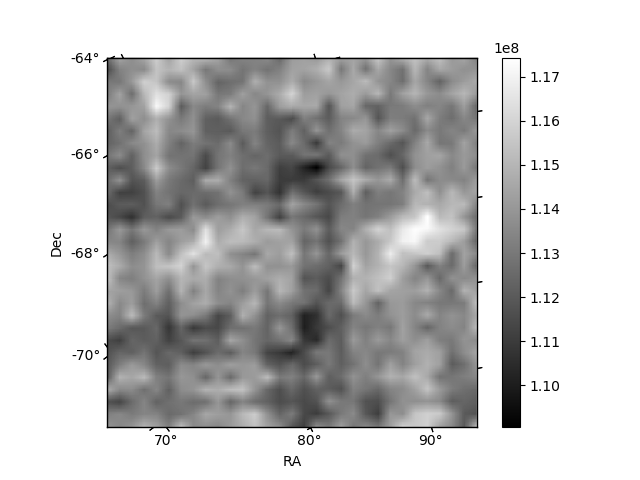
Histogram calculated using DETX and DETY for each event in the final _common_clean file
| Quadrant A | 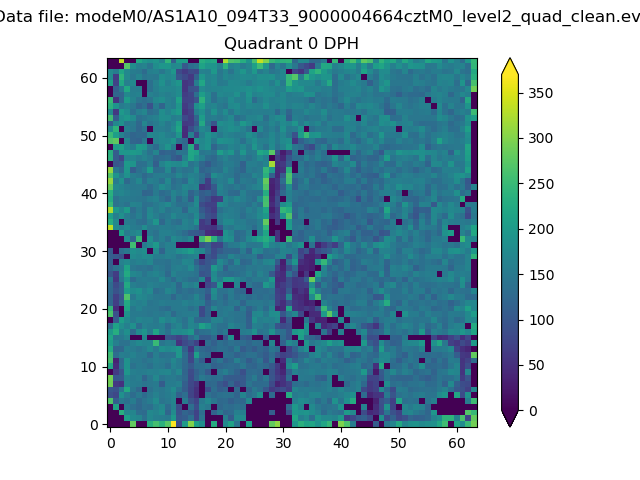 |
 |
Quadrant B |
|---|---|---|---|
| Quadrant D | 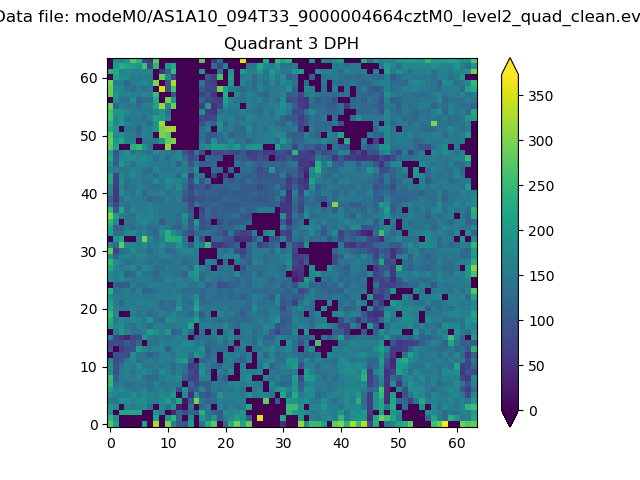 |
 |
Quadrant C |
| Plot type | Count rate plots | Images |
|---|---|---|
| Comparison with Poisson distribution Blue bars denote a histogram of data divided into 1 sec bins. Red curve is a Poisson curve with rate = median count rate of data. |
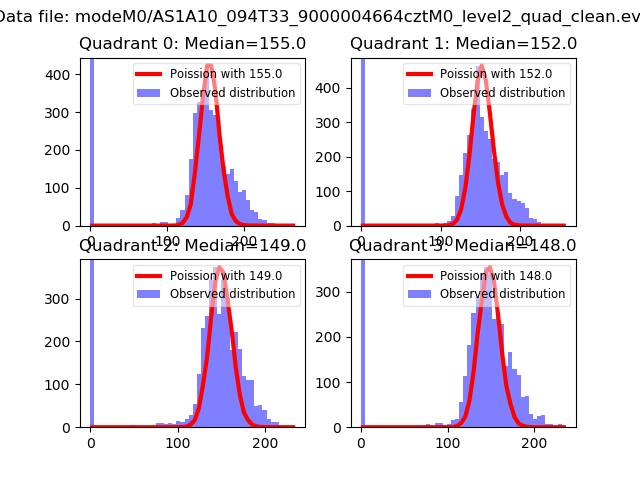 |
 |
| Quadrant-wise count rates Data is divided into 100 sec bins |
 |
|
| Module-wise count rates for Quadrant A Data is divided into 100 sec bins |
 |
 |
| Module-wise count rates for Quadrant B Data is divided into 100 sec bins |
 |
 |
| Module-wise count rates for Quadrant C Data is divided into 100 sec bins |
 |
 |
| Module-wise count rates for Quadrant D Data is divided into 100 sec bins |
 |
 |
| Parameter | Plot |
|---|---|
| CZT HV Monitor |  |
| D_VDD | 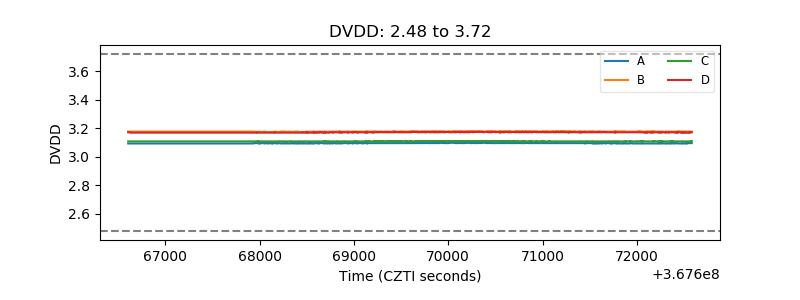 |
| Temperature 1 |  |
| Veto HV Monitor |  |
| Veto LLD |  |
| Alpha Counter | 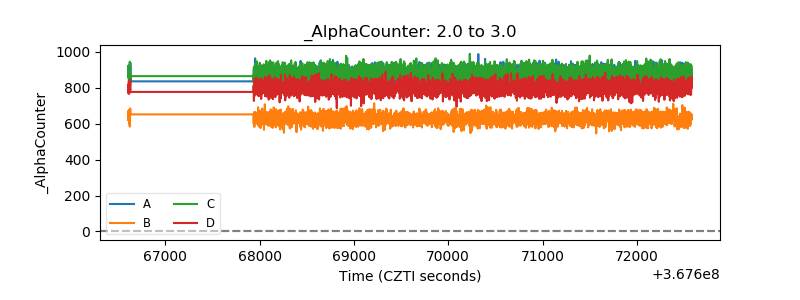 |
| _CPM_Rate |  |
| CZT Counter | 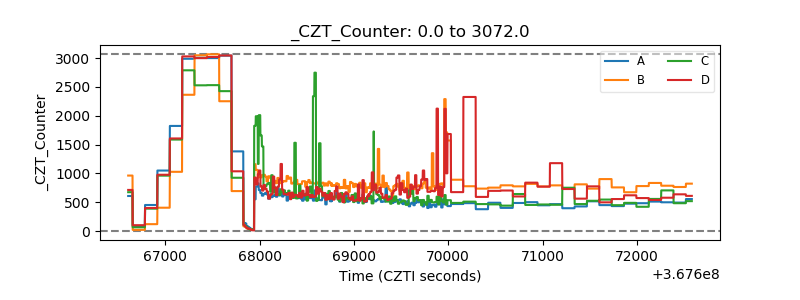 |
| +2.5 Volts monitor |  |
| +5 Volts monitor |  |
| _ROLL_ROT |  |
| _Roll_DEC |  |
| _Roll_RA |  |
| Veto Counter |  |