| Param | Original file | Final file |
|---|---|---|
| Filename | modeM0/AS1A10_094T30_9000004666cztM0_level2_bc.evt | modeM0/AS1A10_094T30_9000004666cztM0_level2_quad_clean.evt |
| Size (bytes) | 209,352,960 | 66,640,320 |
| Size | 199.7 MB | 63.6 MB |
| Events in quadrant A | 954,607 | 443,772 |
| Events in quadrant B | 2,326,951 | 435,972 |
| Events in quadrant C | 1,300,904 | 425,757 |
| Events in quadrant D | 1,470,147 | 422,177 |
| Mode M9 | |||
|---|---|---|---|
| Quadrant | BADHDUFLAG | Total packets | Discarded packets |
| A | 0 | 13 | 0 |
| B | 0 | 13 | 0 |
| C | 0 | 13 | 0 |
| D | 0 | 13 | 0 |
| Mode M0 | |||
|---|---|---|---|
| Quadrant | BADHDUFLAG | Total packets | Discarded packets |
| A | 0 | 8543 | 0 |
| B | 0 | 13517 | 0 |
| C | 0 | 10075 | 0 |
| D | 0 | 10225 | 0 |
| Mode SS | |||
|---|---|---|---|
| Quadrant | BADHDUFLAG | Total packets | Discarded packets |
| A | 0 | 84 | 0 |
| B | 0 | 84 | 0 |
| C | 0 | 84 | 0 |
| D | 0 | 84 | 0 |
| Quadrant | Total seconds | Saturated seconds | Saturation percentage |
|---|---|---|---|
| A | 4120 | 27 | 0.655340% |
| B | 4120 | 194 | 4.708738% |
| C | 4120 | 101 | 2.451456% |
| D | 4120 | 61 | 1.480583% |
Noise dominated data is calculated using 1-second bins in cleaned event files. If a bin has >2000 counts, and if more than 50% of those come from <1% of pixels, then it is considered to be noise-dominated and hence unusable.
| Quadrant | # 1 sec bins | Bins with >0 counts | Bins with >2000 counts | High rate bins dominated by noise | Noise dominated (total time) | Noise dominated (detector-on time) | Marked lightcurve |
|---|---|---|---|---|---|---|---|
| A | 5350 | 4119 | 0 | 0 | 0.00% | 0.00% |  |
| B | 5350 | 4119 | 3 | 3 | 0.06% | 0.07% | 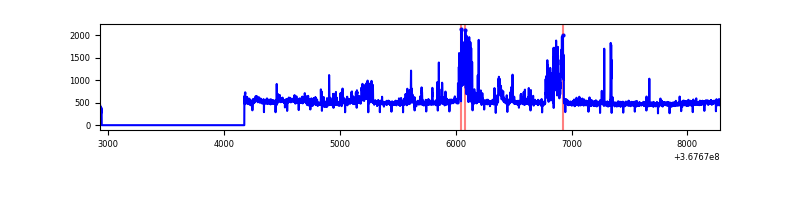 |
| C | 5350 | 4120 | 1 | 1 | 0.02% | 0.02% |  |
| D | 5349 | 4118 | 1 | 1 | 0.02% | 0.02% |  |
Top three noisy pixels from each quadrant. If the there are fewer than three noisy pixels in the level2.evt file, extra rows are filled as -1
| Pixel properties | Quadrant properties | ||||||
|---|---|---|---|---|---|---|---|
| Quadrant | DetID | PixID | Counts | Sigma | Mean | Median | Sigma |
| A | 13 | 254 | 7877 | 143.43 | 242 | 239 | 53.3 |
| A | 14 | 238 | 7174 | 130.23 | 242 | 239 | 53.3 |
| A | 13 | 6 | 5331 | 95.62 | 242 | 239 | 53.3 |
| B | 6 | 159 | 1070078 | 22759.8 | 237 | 232 | 47.0 |
| B | 5 | 172 | 139546 | 2963.75 | 237 | 232 | 47.0 |
| B | 10 | 245 | 108878 | 2311.32 | 237 | 232 | 47.0 |
| C | 3 | 233 | 280320 | 4944.77 | 230 | 231 | 56.6 |
| C | 0 | 10 | 122481 | 2158.24 | 230 | 231 | 56.6 |
| C | 2 | 114 | 7974 | 136.7 | 230 | 231 | 56.6 |
| D | 12 | 33 | 181097 | 3174.72 | 239 | 232 | 57.0 |
| D | 8 | 195 | 135893 | 2381.26 | 239 | 232 | 57.0 |
| D | 13 | 249 | 99215 | 1737.45 | 239 | 232 | 57.0 |
Histogram calculated using DETX and DETY for each event in the final _common_clean file
| Quadrant A |  |
 |
Quadrant B |
|---|---|---|---|
| Quadrant D | 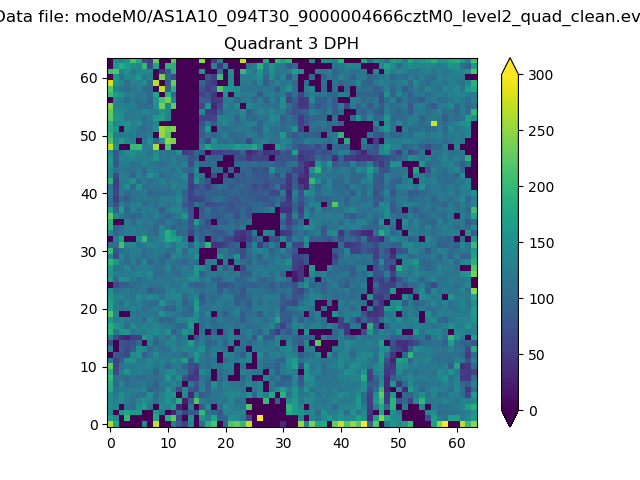 |
 |
Quadrant C |
| Plot type | Count rate plots | Images |
|---|---|---|
| Comparison with Poisson distribution Blue bars denote a histogram of data divided into 1 sec bins. Red curve is a Poisson curve with rate = median count rate of data. |
 |
 |
| Quadrant-wise count rates Data is divided into 100 sec bins |
 |
|
| Module-wise count rates for Quadrant A Data is divided into 100 sec bins |
 |
 |
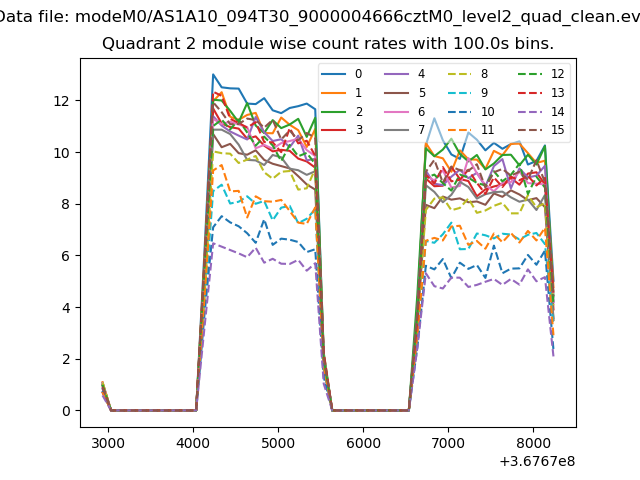
| Module-wise count rates for Quadrant B Data is divided into 100 sec bins |
 |
 |
| Module-wise count rates for Quadrant C Data is divided into 100 sec bins |
 |
 |
| Module-wise count rates for Quadrant D Data is divided into 100 sec bins |
 |
 |
| Parameter | Plot |
|---|---|
| CZT HV Monitor |  |
| D_VDD | 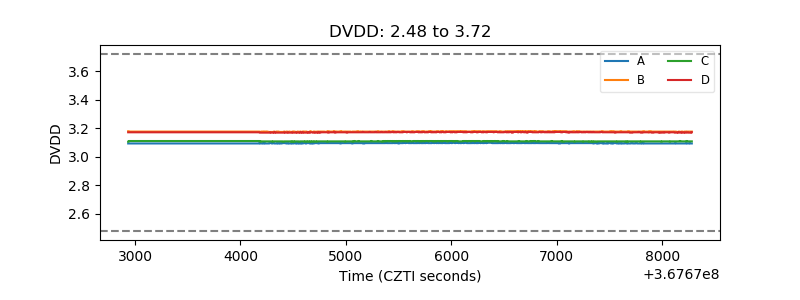 |
| Temperature 1 |  |
| Veto HV Monitor |  |
| Veto LLD |  |
| Alpha Counter |  |
| _CPM_Rate |  |
| CZT Counter |  |
| +2.5 Volts monitor |  |
| +5 Volts monitor | 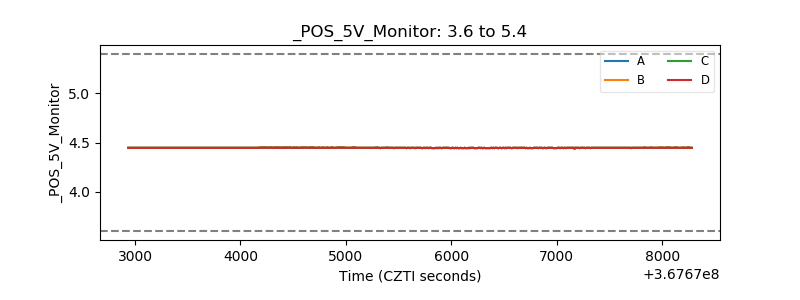 |
| _ROLL_ROT |  |
| _Roll_DEC |  |
| _Roll_RA |  |
| Veto Counter |  |