| Param | Original file | Final file |
|---|---|---|
| Filename | modeM0/AS1A10_053T11_9000004668cztM0_level2_bc.evt | modeM0/AS1A10_053T11_9000004668cztM0_level2_quad_clean.evt |
| Size (bytes) | 1,871,976,960 | 479,831,040 |
| Size | 1.7 GB | 457.6 MB |
| Events in quadrant A | 7,540,012 | 3,099,641 |
| Events in quadrant B | 17,784,803 | 3,070,094 |
| Events in quadrant C | 12,322,367 | 2,978,936 |
| Events in quadrant D | 16,524,775 | 2,840,039 |
| Mode M9 | |||
|---|---|---|---|
| Quadrant | BADHDUFLAG | Total packets | Discarded packets |
| A | 0 | 40 | 0 |
| B | 0 | 40 | 0 |
| C | 0 | 40 | 0 |
| D | 0 | 40 | 0 |
| Mode M0 | |||
|---|---|---|---|
| Quadrant | BADHDUFLAG | Total packets | Discarded packets |
| A | 0 | 76494 | 0 |
| B | 0 | 113625 | 0 |
| C | 0 | 94780 | 0 |
| D | 0 | 109292 | 0 |
| Mode SS | |||
|---|---|---|---|
| Quadrant | BADHDUFLAG | Total packets | Discarded packets |
| A | 0 | 758 | 0 |
| B | 0 | 758 | 0 |
| C | 0 | 758 | 0 |
| D | 0 | 758 | 0 |
| Quadrant | Total seconds | Saturated seconds | Saturation percentage |
|---|---|---|---|
| A | 37027 | 410 | 1.107300% |
| B | 37029 | 1039 | 2.805909% |
| C | 37028 | 1672 | 4.515502% |
| D | 37028 | 2657 | 7.175651% |
Noise dominated data is calculated using 1-second bins in cleaned event files. If a bin has >2000 counts, and if more than 50% of those come from <1% of pixels, then it is considered to be noise-dominated and hence unusable.
| Quadrant | # 1 sec bins | Bins with >0 counts | Bins with >2000 counts | High rate bins dominated by noise | Noise dominated (total time) | Noise dominated (detector-on time) | Marked lightcurve |
|---|---|---|---|---|---|---|---|
| A | 41163 | 37023 | 5 | 5 | 0.01% | 0.01% | 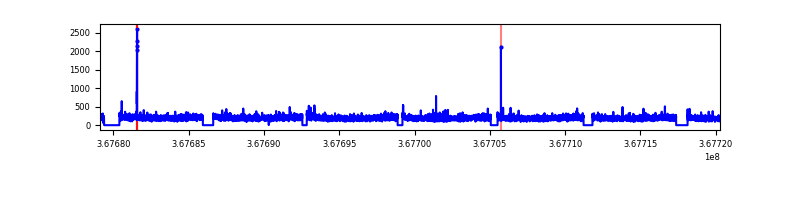 |
| B | 41164 | 37023 | 6 | 6 | 0.01% | 0.02% | 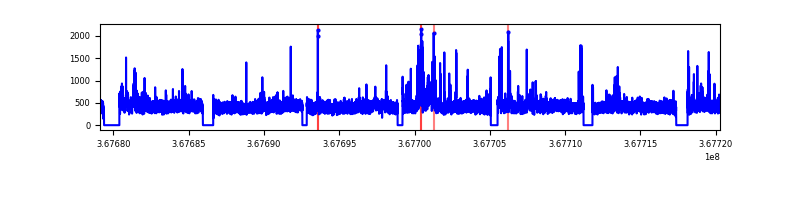 |
| C | 41164 | 37025 | 86 | 86 | 0.21% | 0.23% |  |
| D | 41164 | 37023 | 333 | 333 | 0.81% | 0.90% |  |
Top three noisy pixels from each quadrant. If the there are fewer than three noisy pixels in the level2.evt file, extra rows are filled as -1
| Pixel properties | Quadrant properties | ||||||
|---|---|---|---|---|---|---|---|
| Quadrant | DetID | PixID | Counts | Sigma | Mean | Median | Sigma |
| A | 13 | 254 | 62364 | 143.64 | 1933 | 1899 | 421.0 |
| A | 12 | 96 | 46896 | 106.89 | 1933 | 1899 | 421.0 |
| A | 13 | 6 | 15401 | 32.07 | 1933 | 1899 | 421.0 |
| B | 6 | 159 | 9399497 | 25233.79 | 1928 | 1878 | 372.4 |
| B | 10 | 245 | 592579 | 1586.11 | 1928 | 1878 | 372.4 |
| B | 0 | 190 | 106740 | 281.57 | 1928 | 1878 | 372.4 |
| C | 0 | 10 | 3464532 | 7847.61 | 1847 | 1838 | 441.2 |
| C | 3 | 233 | 1620902 | 3669.33 | 1847 | 1838 | 441.2 |
| C | 2 | 114 | 68468 | 151.01 | 1847 | 1838 | 441.2 |
| D | 7 | 238 | 5327951 | 12482.13 | 1858 | 1797 | 426.7 |
| D | 8 | 195 | 2299383 | 5384.51 | 1858 | 1797 | 426.7 |
| D | 12 | 218 | 606081 | 1416.17 | 1858 | 1797 | 426.7 |
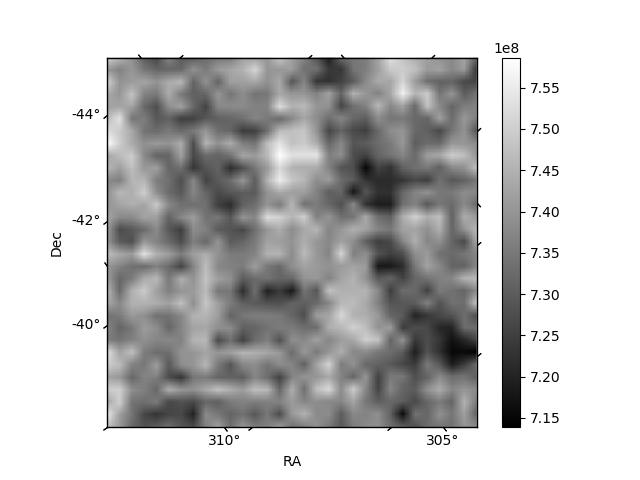
Histogram calculated using DETX and DETY for each event in the final _common_clean file
| Quadrant A |  |
 |
Quadrant B |
|---|---|---|---|
| Quadrant D |  |
 |
Quadrant C |
| Plot type | Count rate plots | Images |
|---|---|---|
| Comparison with Poisson distribution Blue bars denote a histogram of data divided into 1 sec bins. Red curve is a Poisson curve with rate = median count rate of data. |
 |
 |
| Quadrant-wise count rates Data is divided into 100 sec bins |
 |
|
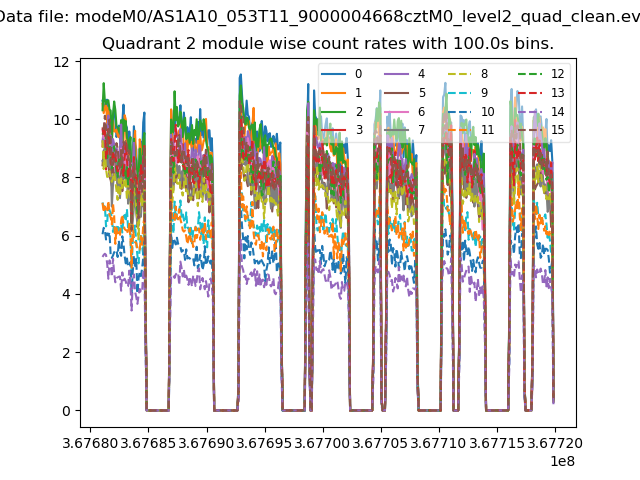
| Module-wise count rates for Quadrant A Data is divided into 100 sec bins |
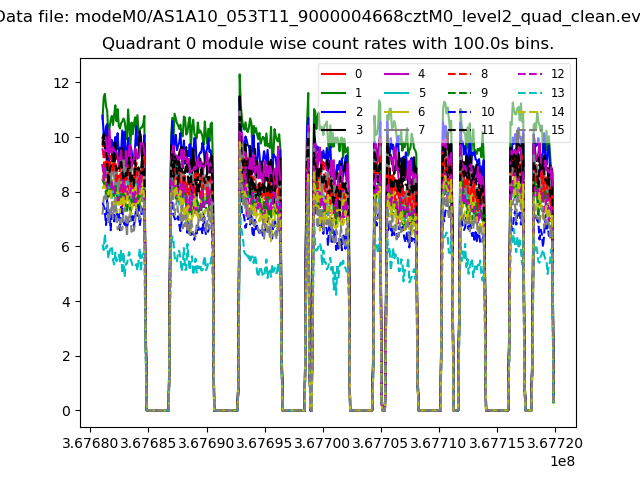 |
 |
| Module-wise count rates for Quadrant B Data is divided into 100 sec bins |
 |
 |
| Module-wise count rates for Quadrant C Data is divided into 100 sec bins |
 |
 |
| Module-wise count rates for Quadrant D Data is divided into 100 sec bins |
 |
 |
| Parameter | Plot |
|---|---|
| CZT HV Monitor |  |
| D_VDD |  |
| Temperature 1 |  |
| Veto HV Monitor |  |
| Veto LLD |  |
| Alpha Counter |  |
| _CPM_Rate |  |
| CZT Counter |  |
| +2.5 Volts monitor | 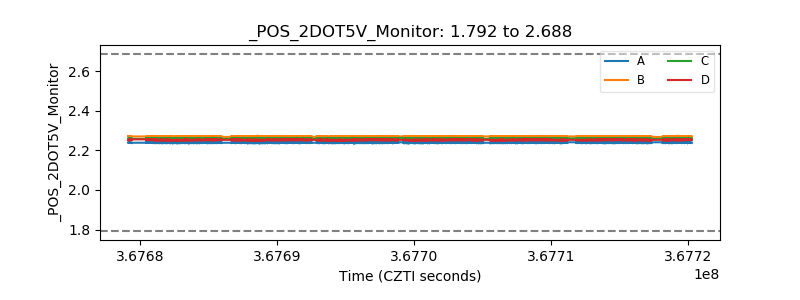 |
| +5 Volts monitor |  |
| _ROLL_ROT |  |
| _Roll_DEC |  |
| _Roll_RA |  |
| Veto Counter | 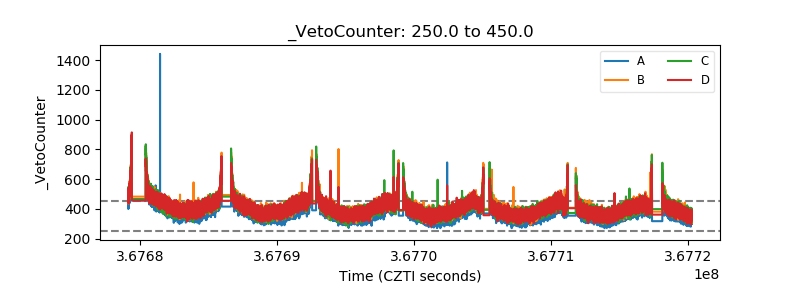 |