| Param | Original file | Final file |
|---|---|---|
| Filename | modeM0/AS1C06_010T03_9000004658cztM0_level2_bc.evt | modeM0/AS1C06_010T03_9000004658cztM0_level2_quad_clean.evt |
| Size (bytes) | 916,724,160 | 219,438,720 |
| Size | 874.3 MB | 209.3 MB |
| Events in quadrant A | 3,186,947 | 1,570,205 |
| Events in quadrant B | 8,210,803 | 1,500,559 |
| Events in quadrant C | 5,934,613 | 1,442,754 |
| Events in quadrant D | 9,626,974 | 1,317,868 |
| Mode SS | |||
|---|---|---|---|
| Quadrant | BADHDUFLAG | Total packets | Discarded packets |
| A | 0 | 238 | 0 |
| B | 0 | 238 | 0 |
| C | 0 | 238 | 0 |
| D | 0 | 238 | 0 |
| Mode M9 | |||
|---|---|---|---|
| Quadrant | BADHDUFLAG | Total packets | Discarded packets |
| A | 0 | 12 | 0 |
| B | 0 | 12 | 0 |
| C | 0 | 12 | 0 |
| D | 0 | 12 | 0 |
| Mode M0 | |||
|---|---|---|---|
| Quadrant | BADHDUFLAG | Total packets | Discarded packets |
| A | 0 | 26704 | 0 |
| B | 0 | 44276 | 0 |
| C | 0 | 40006 | 0 |
| D | 0 | 51462 | 0 |
| Quadrant | Total seconds | Saturated seconds | Saturation percentage |
|---|---|---|---|
| A | 11761 | 129 | 1.096846% |
| B | 11759 | 1293 | 10.995833% |
| C | 11761 | 1287 | 10.942947% |
| D | 11760 | 3154 | 26.819728% |
Noise dominated data is calculated using 1-second bins in cleaned event files. If a bin has >2000 counts, and if more than 50% of those come from <1% of pixels, then it is considered to be noise-dominated and hence unusable.
| Quadrant | # 1 sec bins | Bins with >0 counts | Bins with >2000 counts | High rate bins dominated by noise | Noise dominated (total time) | Noise dominated (detector-on time) | Marked lightcurve |
|---|---|---|---|---|---|---|---|
| A | 12915 | 11760 | 1 | 1 | 0.01% | 0.01% |  |
| B | 12915 | 11758 | 7 | 7 | 0.05% | 0.06% |  |
| C | 12916 | 11759 | 5 | 5 | 0.04% | 0.04% |  |
| D | 12915 | 11757 | 199 | 199 | 1.54% | 1.69% | 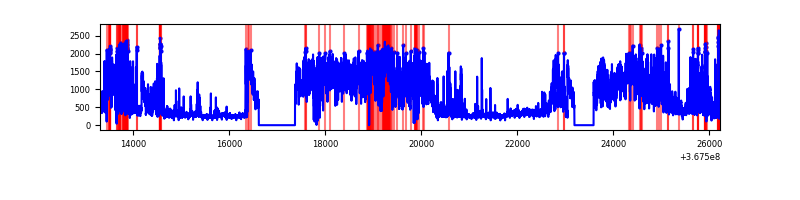 |
Top three noisy pixels from each quadrant. If the there are fewer than three noisy pixels in the level2.evt file, extra rows are filled as -1
| Pixel properties | Quadrant properties | ||||||
|---|---|---|---|---|---|---|---|
| Quadrant | DetID | PixID | Counts | Sigma | Mean | Median | Sigma |
| A | 12 | 96 | 735464 | 5290.26 | 628 | 619 | 138.9 |
| A | 13 | 254 | 21335 | 149.14 | 628 | 619 | 138.9 |
| A | 13 | 6 | 17492 | 121.47 | 628 | 619 | 138.9 |
| B | 6 | 159 | 3209847 | 26763.03 | 607 | 593 | 119.9 |
| B | 5 | 255 | 2156550 | 17979.24 | 607 | 593 | 119.9 |
| B | 5 | 172 | 193004 | 1604.58 | 607 | 593 | 119.9 |
| C | 3 | 233 | 3277734 | 23424.4 | 577 | 577 | 139.9 |
| C | 0 | 10 | 355194 | 2534.72 | 577 | 577 | 139.9 |
| C | 4 | 175 | 23046 | 160.6 | 577 | 577 | 139.9 |
| D | 12 | 33 | 4064485 | 30659.53 | 555 | 537 | 132.6 |
| D | 8 | 195 | 1845724 | 13920.59 | 555 | 537 | 132.6 |
| D | 13 | 249 | 1014432 | 7649.1 | 555 | 537 | 132.6 |
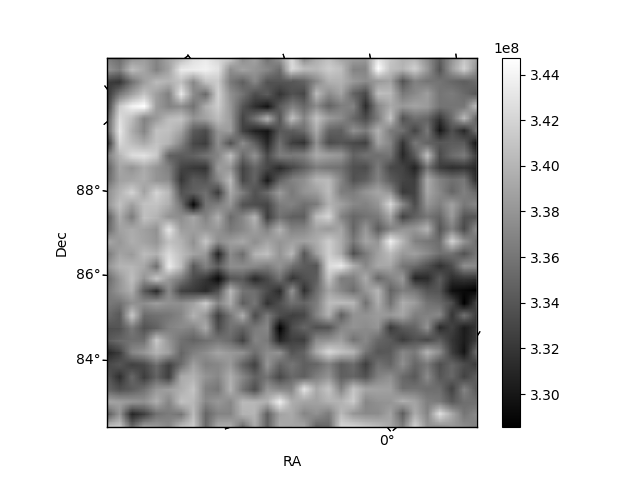
Histogram calculated using DETX and DETY for each event in the final _common_clean file
| Quadrant A |  |
 |
Quadrant B |
|---|---|---|---|
| Quadrant D |  |
 |
Quadrant C |
| Plot type | Count rate plots | Images |
|---|---|---|
| Comparison with Poisson distribution Blue bars denote a histogram of data divided into 1 sec bins. Red curve is a Poisson curve with rate = median count rate of data. |
 |
 |
| Quadrant-wise count rates Data is divided into 100 sec bins |
 |
|
| Module-wise count rates for Quadrant A Data is divided into 100 sec bins |
 |
 |
| Module-wise count rates for Quadrant B Data is divided into 100 sec bins |
 |
 |
| Module-wise count rates for Quadrant C Data is divided into 100 sec bins |
 |
 |
| Module-wise count rates for Quadrant D Data is divided into 100 sec bins |
 |
 |
| Parameter | Plot |
|---|---|
| CZT HV Monitor |  |
| D_VDD |  |
| Temperature 1 |  |
| Veto HV Monitor |  |
| Veto LLD |  |
| Alpha Counter |  |
| _CPM_Rate |  |
| CZT Counter |  |
| +2.5 Volts monitor |  |
| +5 Volts monitor |  |
| _ROLL_ROT |  |
| _Roll_DEC |  |
| _Roll_RA |  |
| Veto Counter |  |