| Param | Original file | Final file |
|---|---|---|
| Filename | modeM0/AS1A10_059T01_9000004656cztM0_level2_bc.evt | modeM0/AS1A10_059T01_9000004656cztM0_level2_quad_clean.evt |
| Size (bytes) | 2,191,501,440 | 496,926,720 |
| Size | 2.0 GB | 473.9 MB |
| Events in quadrant A | 8,274,966 | 3,410,998 |
| Events in quadrant B | 17,921,458 | 3,343,876 |
| Events in quadrant C | 14,860,817 | 3,230,289 |
| Events in quadrant D | 23,200,856 | 2,926,510 |
| Mode M0 | |||
|---|---|---|---|
| Quadrant | BADHDUFLAG | Total packets | Discarded packets |
| A | 0 | 70331 | 0 |
| B | 0 | 103331 | 0 |
| C | 0 | 101926 | 0 |
| D | 0 | 127474 | 0 |
| Mode M9 | |||
|---|---|---|---|
| Quadrant | BADHDUFLAG | Total packets | Discarded packets |
| A | 0 | 71 | 0 |
| B | 0 | 71 | 0 |
| C | 0 | 71 | 0 |
| D | 0 | 71 | 0 |
| Mode SS | |||
|---|---|---|---|
| Quadrant | BADHDUFLAG | Total packets | Discarded packets |
| A | 0 | 634 | 0 |
| B | 0 | 634 | 0 |
| C | 0 | 634 | 0 |
| D | 0 | 634 | 0 |
| Quadrant | Total seconds | Saturated seconds | Saturation percentage |
|---|---|---|---|
| A | 31119 | 532 | 1.709567% |
| B | 31119 | 1437 | 4.617758% |
| C | 31119 | 2296 | 7.378129% |
| D | 31119 | 4494 | 14.441338% |
Noise dominated data is calculated using 1-second bins in cleaned event files. If a bin has >2000 counts, and if more than 50% of those come from <1% of pixels, then it is considered to be noise-dominated and hence unusable.
| Quadrant | # 1 sec bins | Bins with >0 counts | Bins with >2000 counts | High rate bins dominated by noise | Noise dominated (total time) | Noise dominated (detector-on time) | Marked lightcurve |
|---|---|---|---|---|---|---|---|
| A | 38363 | 31115 | 4 | 4 | 0.01% | 0.01% |  |
| B | 38364 | 31118 | 50 | 50 | 0.13% | 0.16% |  |
| C | 38365 | 31118 | 42 | 42 | 0.11% | 0.13% |  |
| D | 38365 | 31119 | 284 | 284 | 0.74% | 0.91% |  |
Top three noisy pixels from each quadrant. If the there are fewer than three noisy pixels in the level2.evt file, extra rows are filled as -1
| Pixel properties | Quadrant properties | ||||||
|---|---|---|---|---|---|---|---|
| Quadrant | DetID | PixID | Counts | Sigma | Mean | Median | Sigma |
| A | 12 | 96 | 765654 | 1863.17 | 1933 | 1911 | 409.9 |
| A | 13 | 254 | 57689 | 136.07 | 1933 | 1911 | 409.9 |
| A | 13 | 6 | 40074 | 93.1 | 1933 | 1911 | 409.9 |
| B | 6 | 159 | 7946954 | 22452.87 | 1910 | 1879 | 353.9 |
| B | 4 | 80 | 1928928 | 5445.86 | 1910 | 1879 | 353.9 |
| B | 5 | 172 | 383919 | 1079.65 | 1910 | 1879 | 353.9 |
| C | 3 | 233 | 6300221 | 14950.04 | 1806 | 1812 | 421.3 |
| C | 0 | 10 | 1364628 | 3234.81 | 1806 | 1812 | 421.3 |
| C | 15 | 208 | 100413 | 234.04 | 1806 | 1812 | 421.3 |
| D | 12 | 33 | 8181395 | 20703.12 | 1781 | 1734 | 395.1 |
| D | 8 | 195 | 5055158 | 12790.46 | 1781 | 1734 | 395.1 |
| D | 13 | 249 | 1591815 | 4024.57 | 1781 | 1734 | 395.1 |
Histogram calculated using DETX and DETY for each event in the final _common_clean file
| Quadrant A | 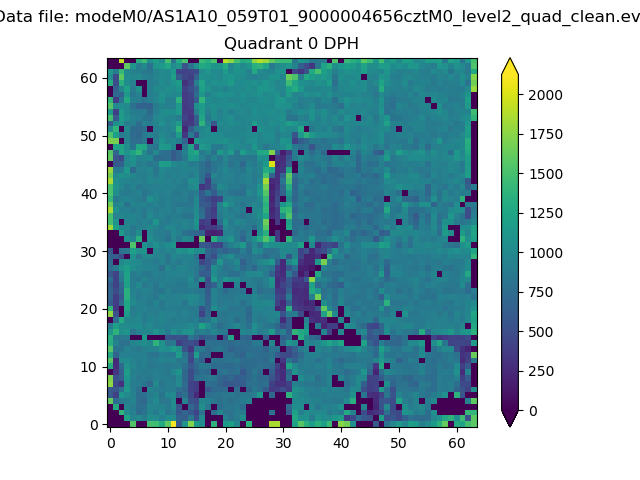 |
 |
Quadrant B |
|---|---|---|---|
| Quadrant D |  |
 |
Quadrant C |
| Plot type | Count rate plots | Images |
|---|---|---|
| Comparison with Poisson distribution Blue bars denote a histogram of data divided into 1 sec bins. Red curve is a Poisson curve with rate = median count rate of data. |
 |
 |
| Quadrant-wise count rates Data is divided into 100 sec bins |
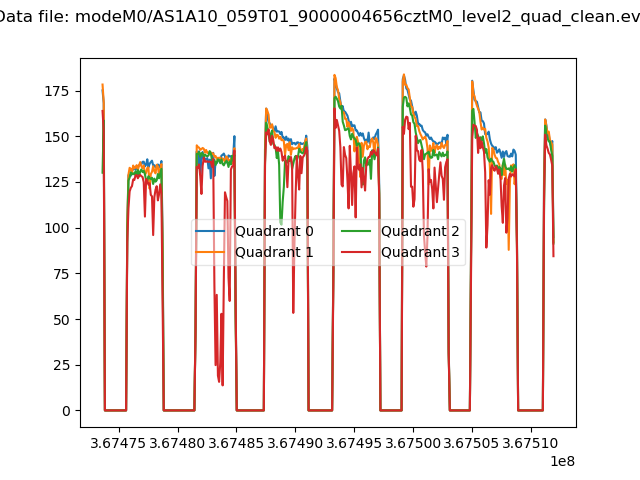 |
|
| Module-wise count rates for Quadrant A Data is divided into 100 sec bins |
 |
 |
| Module-wise count rates for Quadrant B Data is divided into 100 sec bins |
 |
 |
| Module-wise count rates for Quadrant C Data is divided into 100 sec bins |
 |
 |
| Module-wise count rates for Quadrant D Data is divided into 100 sec bins |
 |
 |
| Parameter | Plot |
|---|---|
| CZT HV Monitor | 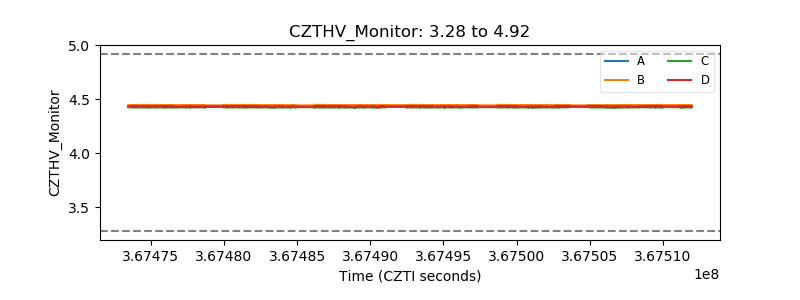 |
| D_VDD |  |
| Temperature 1 |  |
| Veto HV Monitor |  |
| Veto LLD |  |
| Alpha Counter |  |
| _CPM_Rate |  |
| CZT Counter | 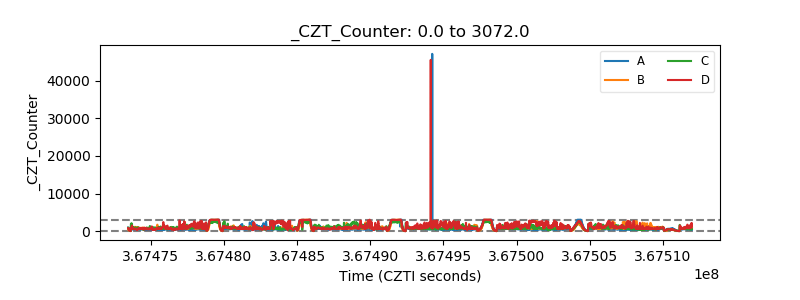 |
| +2.5 Volts monitor |  |
| +5 Volts monitor |  |
| _ROLL_ROT |  |
| _Roll_DEC |  |
| _Roll_RA |  |
| Veto Counter | 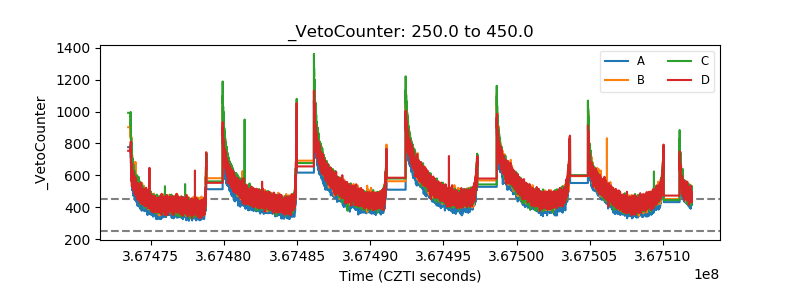 |