| Param | Original file | Final file |
|---|---|---|
| Filename | modeM0/AS1T04_044T01_9000004652cztM0_level2_bc.evt | modeM0/AS1T04_044T01_9000004652cztM0_level2_quad_clean.evt |
| Size (bytes) | 819,469,440 | 181,866,240 |
| Size | 781.5 MB | 173.4 MB |
| Events in quadrant A | 3,151,106 | 1,189,777 |
| Events in quadrant B | 8,626,245 | 1,142,234 |
| Events in quadrant C | 6,719,570 | 1,075,724 |
| Events in quadrant D | 5,347,231 | 1,116,053 |
| Mode SS | |||
|---|---|---|---|
| Quadrant | BADHDUFLAG | Total packets | Discarded packets |
| A | 0 | 296 | 0 |
| B | 0 | 294 | 0 |
| C | 0 | 296 | 0 |
| D | 0 | 296 | 0 |
| Mode M9 | |||
|---|---|---|---|
| Quadrant | BADHDUFLAG | Total packets | Discarded packets |
| A | 0 | 25 | 0 |
| B | 0 | 25 | 0 |
| C | 0 | 25 | 0 |
| D | 0 | 25 | 0 |
| Mode M0 | |||
|---|---|---|---|
| Quadrant | BADHDUFLAG | Total packets | Discarded packets |
| A | 0 | 29623 | 0 |
| B | 0 | 48723 | 0 |
| C | 0 | 45647 | 0 |
| D | 0 | 36835 | 0 |
| Quadrant | Total seconds | Saturated seconds | Saturation percentage |
|---|---|---|---|
| A | 14275 | 88 | 0.616462% |
| B | 14138 | 953 | 6.740699% |
| C | 14229 | 1300 | 9.136271% |
| D | 14250 | 153 | 1.073684% |
Noise dominated data is calculated using 1-second bins in cleaned event files. If a bin has >2000 counts, and if more than 50% of those come from <1% of pixels, then it is considered to be noise-dominated and hence unusable.
| Quadrant | # 1 sec bins | Bins with >0 counts | Bins with >2000 counts | High rate bins dominated by noise | Noise dominated (total time) | Noise dominated (detector-on time) | Marked lightcurve |
|---|---|---|---|---|---|---|---|
| A | 17298 | 14359 | 0 | 0 | 0.00% | 0.00% |  |
| B | 17298 | 14230 | 96 | 96 | 0.55% | 0.67% |  |
| C | 17299 | 14333 | 7 | 7 | 0.04% | 0.05% | 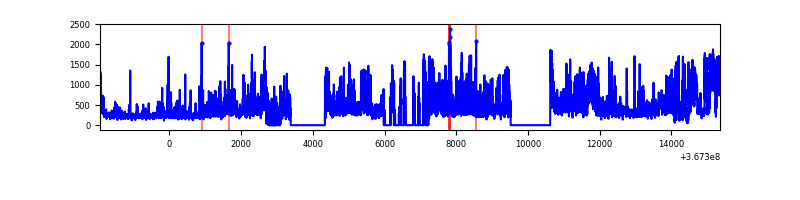 |
| D | 17298 | 14346 | 12 | 12 | 0.07% | 0.08% |  |
Top three noisy pixels from each quadrant. If the there are fewer than three noisy pixels in the level2.evt file, extra rows are filled as -1
| Pixel properties | Quadrant properties | ||||||
|---|---|---|---|---|---|---|---|
| Quadrant | DetID | PixID | Counts | Sigma | Mean | Median | Sigma |
| A | 13 | 254 | 19520 | 107.47 | 809 | 797 | 174.2 |
| A | 13 | 6 | 17699 | 97.02 | 809 | 797 | 174.2 |
| A | 12 | 96 | 12600 | 67.75 | 809 | 797 | 174.2 |
| B | 6 | 159 | 3557752 | 23208.58 | 794 | 776 | 153.3 |
| B | 10 | 245 | 1949056 | 12712.15 | 794 | 776 | 153.3 |
| B | 0 | 229 | 37975 | 242.72 | 794 | 776 | 153.3 |
| C | 3 | 233 | 2784444 | 16105.81 | 735 | 733 | 172.8 |
| C | 0 | 10 | 1022029 | 5908.95 | 735 | 733 | 172.8 |
| C | 15 | 159 | 30966 | 174.92 | 735 | 733 | 172.8 |
| D | 8 | 195 | 1627930 | 9224.65 | 782 | 760 | 176.4 |
| D | 2 | 250 | 204086 | 1152.68 | 782 | 760 | 176.4 |
| D | 1 | 52 | 136175 | 767.69 | 782 | 760 | 176.4 |
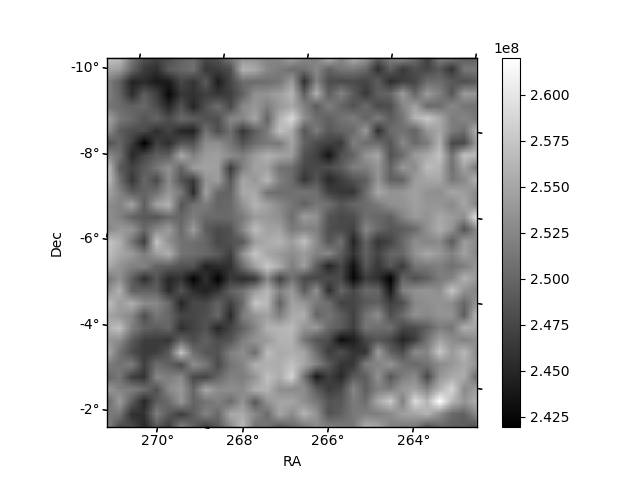
Histogram calculated using DETX and DETY for each event in the final _common_clean file
| Quadrant A |  |
 |
Quadrant B |
|---|---|---|---|
| Quadrant D | 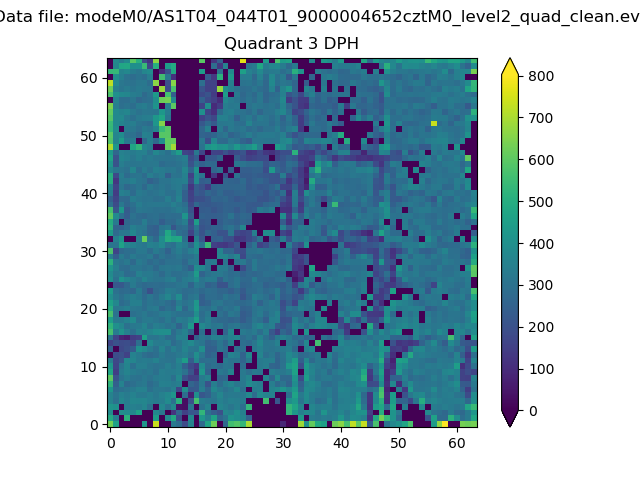 |
 |
Quadrant C |
| Plot type | Count rate plots | Images |
|---|---|---|
| Comparison with Poisson distribution Blue bars denote a histogram of data divided into 1 sec bins. Red curve is a Poisson curve with rate = median count rate of data. |
 |
 |
| Quadrant-wise count rates Data is divided into 100 sec bins |
 |
|
| Module-wise count rates for Quadrant A Data is divided into 100 sec bins |
 |
 |
| Module-wise count rates for Quadrant B Data is divided into 100 sec bins |
 |
 |
| Module-wise count rates for Quadrant C Data is divided into 100 sec bins |
 |
 |
| Module-wise count rates for Quadrant D Data is divided into 100 sec bins |
 |
 |
| Parameter | Plot |
|---|---|
| CZT HV Monitor |  |
| D_VDD |  |
| Temperature 1 |  |
| Veto HV Monitor | 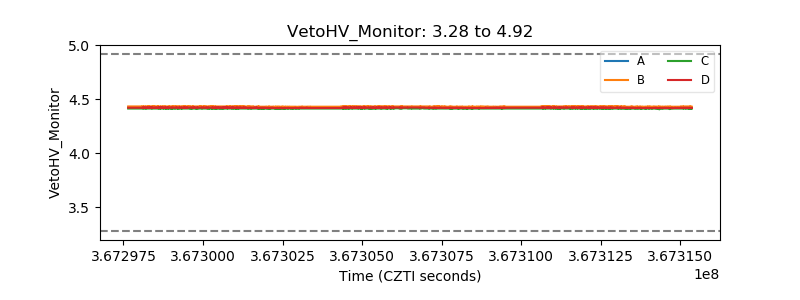 |
| Veto LLD |  |
| Alpha Counter | 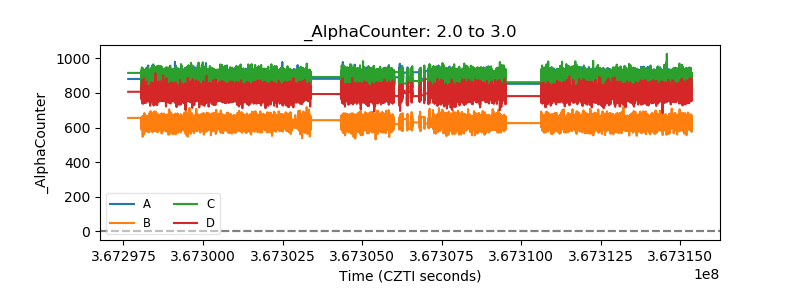 |
| _CPM_Rate |  |
| CZT Counter |  |
| +2.5 Volts monitor |  |
| +5 Volts monitor |  |
| _ROLL_ROT |  |
| _Roll_DEC |  |
| _Roll_RA |  |
| Veto Counter | 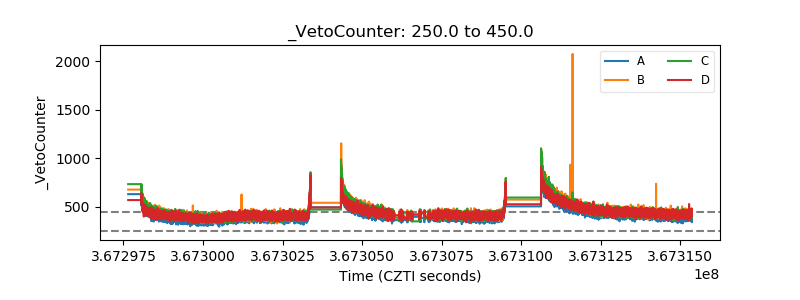 |