| Param | Original file | Final file |
|---|---|---|
| Filename | modeM0/AS1A10_123T09_9000004654cztM0_level2_bc.evt | modeM0/AS1A10_123T09_9000004654cztM0_level2_quad_clean.evt |
| Size (bytes) | 7,967,278,080 | 1,521,728,640 |
| Size | 7.4 GB | 1.4 GB |
| Events in quadrant A | 24,914,140 | 10,787,610 |
| Events in quadrant B | 69,393,319 | 9,935,328 |
| Events in quadrant C | 46,479,378 | 9,674,836 |
| Events in quadrant D | 93,015,136 | 8,112,106 |
| Mode M0 | |||
|---|---|---|---|
| Quadrant | BADHDUFLAG | Total packets | Discarded packets |
| A | 0 | 233004 | 0 |
| B | 0 | 401505 | 0 |
| C | 0 | 329918 | 0 |
| D | 0 | 517911 | 0 |
| Mode SS | |||
|---|---|---|---|
| Quadrant | BADHDUFLAG | Total packets | Discarded packets |
| A | 0 | 2257 | 0 |
| B | 0 | 2256 | 0 |
| C | 0 | 2268 | 0 |
| D | 0 | 2256 | 0 |
| Mode M9 | |||
|---|---|---|---|
| Quadrant | BADHDUFLAG | Total packets | Discarded packets |
| A | 0 | 179 | 0 |
| B | 0 | 180 | 0 |
| C | 0 | 177 | 0 |
| D | 0 | 181 | 0 |
| Quadrant | Total seconds | Saturated seconds | Saturation percentage |
|---|---|---|---|
| A | 110611 | 1148 | 1.037871% |
| B | 110266 | 12159 | 11.026971% |
| C | 110333 | 9295 | 8.424497% |
| D | 110233 | 31624 | 28.688324% |
Noise dominated data is calculated using 1-second bins in cleaned event files. If a bin has >2000 counts, and if more than 50% of those come from <1% of pixels, then it is considered to be noise-dominated and hence unusable.
| Quadrant | # 1 sec bins | Bins with >0 counts | Bins with >2000 counts | High rate bins dominated by noise | Noise dominated (total time) | Noise dominated (detector-on time) | Marked lightcurve |
|---|---|---|---|---|---|---|---|
| A | 155446 | 111109 | 9 | 9 | 0.01% | 0.01% |  |
| B | 155447 | 110747 | 473 | 473 | 0.30% | 0.43% |  |
| C | 155447 | 110832 | 133 | 133 | 0.09% | 0.12% |  |
| D | 155446 | 110707 | 1782 | 1782 | 1.15% | 1.61% |  |
Top three noisy pixels from each quadrant. If the there are fewer than three noisy pixels in the level2.evt file, extra rows are filled as -1
| Pixel properties | Quadrant properties | ||||||
|---|---|---|---|---|---|---|---|
| Quadrant | DetID | PixID | Counts | Sigma | Mean | Median | Sigma |
| A | 15 | 174 | 275975 | 200.82 | 6285 | 6204 | 1343.3 |
| A | 13 | 254 | 209501 | 151.34 | 6285 | 6204 | 1343.3 |
| A | 13 | 6 | 182961 | 131.58 | 6285 | 6204 | 1343.3 |
| B | 6 | 159 | 28961429 | 26031.27 | 5899 | 5776 | 1112.3 |
| B | 4 | 80 | 7509981 | 6746.32 | 5899 | 5776 | 1112.3 |
| B | 5 | 172 | 4525420 | 4063.18 | 5899 | 5776 | 1112.3 |
| C | 3 | 233 | 16090608 | 11897.47 | 5716 | 5707 | 1352.0 |
| C | 0 | 10 | 7321640 | 5411.35 | 5716 | 5707 | 1352.0 |
| C | 14 | 254 | 240263 | 173.49 | 5716 | 5707 | 1352.0 |
| D | 12 | 33 | 41730210 | 34262.6 | 5285 | 5135 | 1217.8 |
| D | 8 | 195 | 19307002 | 15849.75 | 5285 | 5135 | 1217.8 |
| D | 12 | 218 | 3075592 | 2521.31 | 5285 | 5135 | 1217.8 |
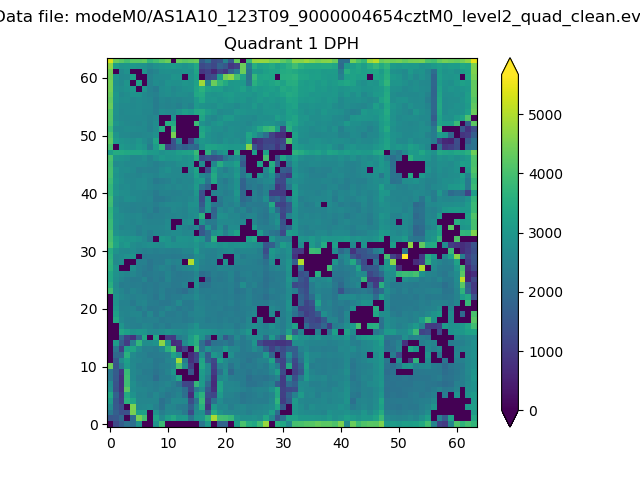
Histogram calculated using DETX and DETY for each event in the final _common_clean file
| Quadrant A |  |
 |
Quadrant B |
|---|---|---|---|
| Quadrant D |  |
 |
Quadrant C |
| Plot type | Count rate plots | Images |
|---|---|---|
| Comparison with Poisson distribution Blue bars denote a histogram of data divided into 1 sec bins. Red curve is a Poisson curve with rate = median count rate of data. |
 |
 |
| Quadrant-wise count rates Data is divided into 100 sec bins |
 |
|
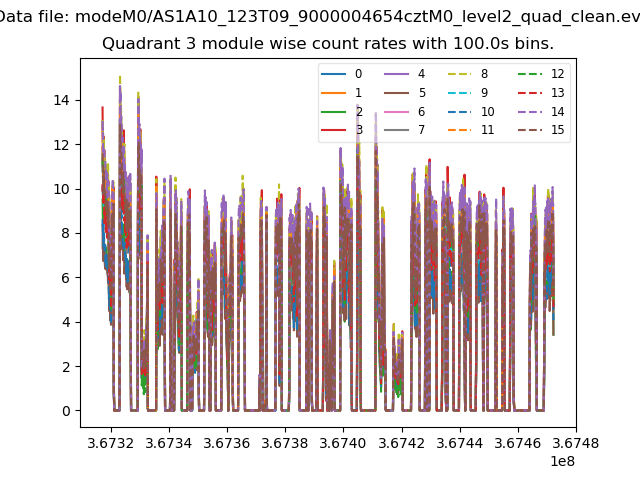
| Module-wise count rates for Quadrant A Data is divided into 100 sec bins |
 |
 |
| Module-wise count rates for Quadrant B Data is divided into 100 sec bins |
 |
 |
| Module-wise count rates for Quadrant C Data is divided into 100 sec bins |
 |
 |
| Module-wise count rates for Quadrant D Data is divided into 100 sec bins |
 |
 |
| Parameter | Plot |
|---|---|
| CZT HV Monitor |  |
| D_VDD |  |
| Temperature 1 |  |
| Veto HV Monitor |  |
| Veto LLD |  |
| Alpha Counter | 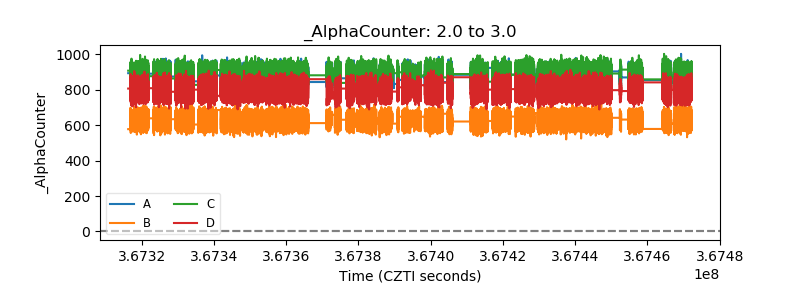 |
| _CPM_Rate |  |
| CZT Counter |  |
| +2.5 Volts monitor |  |
| +5 Volts monitor |  |
| _ROLL_ROT | 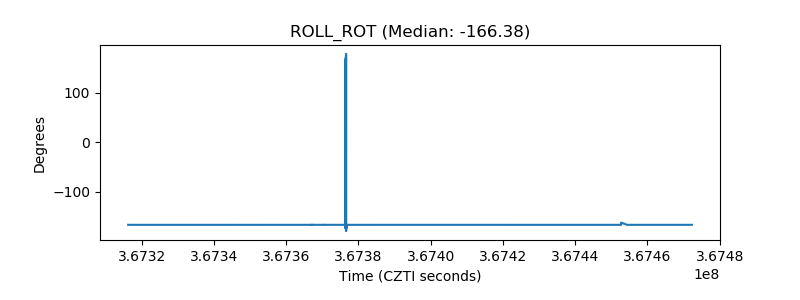 |
| _Roll_DEC |  |
| _Roll_RA |  |
| Veto Counter | 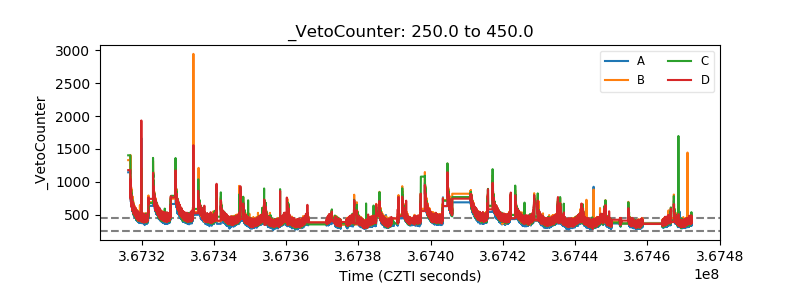 |