| Param | Original file | Final file |
|---|---|---|
| Filename | modeM0/AS1T04_041T01_9000004642cztM0_level2_bc.evt | modeM0/AS1T04_041T01_9000004642cztM0_level2_quad_clean.evt |
| Size (bytes) | 5,748,816,960 | 1,348,355,520 |
| Size | 5.4 GB | 1.3 GB |
| Events in quadrant A | 55,640,931 | 7,881,792 |
| Events in quadrant B | 50,060,828 | 9,114,086 |
| Events in quadrant C | 26,960,314 | 8,697,208 |
| Events in quadrant D | 34,954,769 | 8,598,626 |
| Mode M9 | |||
|---|---|---|---|
| Quadrant | BADHDUFLAG | Total packets | Discarded packets |
| A | 0 | 155 | 0 |
| B | 0 | 155 | 0 |
| C | 0 | 155 | 0 |
| D | 0 | 155 | 0 |
| Mode M0 | |||
|---|---|---|---|
| Quadrant | BADHDUFLAG | Total packets | Discarded packets |
| A | 0 | 370757 | 0 |
| B | 0 | 301091 | 0 |
| C | 0 | 231318 | 0 |
| D | 0 | 242574 | 0 |
| Mode SS | |||
|---|---|---|---|
| Quadrant | BADHDUFLAG | Total packets | Discarded packets |
| A | 0 | 1948 | 0 |
| B | 0 | 1948 | 0 |
| C | 0 | 1948 | 0 |
| D | 0 | 1948 | 0 |
| Quadrant | Total seconds | Saturated seconds | Saturation percentage |
|---|---|---|---|
| A | 95444 | 25746 | 26.974980% |
| B | 95444 | 3280 | 3.436570% |
| C | 95444 | 6193 | 6.488622% |
| D | 95444 | 1735 | 1.817820% |
Noise dominated data is calculated using 1-second bins in cleaned event files. If a bin has >2000 counts, and if more than 50% of those come from <1% of pixels, then it is considered to be noise-dominated and hence unusable.
| Quadrant | # 1 sec bins | Bins with >0 counts | Bins with >2000 counts | High rate bins dominated by noise | Noise dominated (total time) | Noise dominated (detector-on time) | Marked lightcurve |
|---|---|---|---|---|---|---|---|
| A | 110934 | 95428 | 1007 | 1007 | 0.91% | 1.06% |  |
| B | 110934 | 95446 | 102 | 102 | 0.09% | 0.11% |  |
| C | 110934 | 95447 | 29 | 29 | 0.03% | 0.03% |  |
| D | 110934 | 95445 | 101 | 101 | 0.09% | 0.11% |  |
Top three noisy pixels from each quadrant. If the there are fewer than three noisy pixels in the level2.evt file, extra rows are filled as -1
| Pixel properties | Quadrant properties | ||||||
|---|---|---|---|---|---|---|---|
| Quadrant | DetID | PixID | Counts | Sigma | Mean | Median | Sigma |
| A | 0 | 13 | 37283101 | 36734.24 | 4721 | 4664 | 1014.8 |
| A | 13 | 254 | 141493 | 134.83 | 4721 | 4664 | 1014.8 |
| A | 13 | 6 | 86400 | 80.54 | 4721 | 4664 | 1014.8 |
| B | 6 | 159 | 24585112 | 23638.53 | 5471 | 5361 | 1039.8 |
| B | 10 | 245 | 3193877 | 3066.42 | 5471 | 5361 | 1039.8 |
| B | 5 | 255 | 636365 | 606.84 | 5471 | 5361 | 1039.8 |
| C | 0 | 10 | 3988983 | 3240.49 | 5173 | 5185 | 1229.4 |
| C | 3 | 233 | 2132391 | 1730.31 | 5173 | 5185 | 1229.4 |
| C | 14 | 254 | 395817 | 317.75 | 5173 | 5185 | 1229.4 |
| D | 8 | 195 | 9466968 | 7746.55 | 5386 | 5249 | 1221.4 |
| D | 12 | 227 | 1673536 | 1365.87 | 5386 | 5249 | 1221.4 |
| D | 12 | 233 | 1084026 | 883.22 | 5386 | 5249 | 1221.4 |
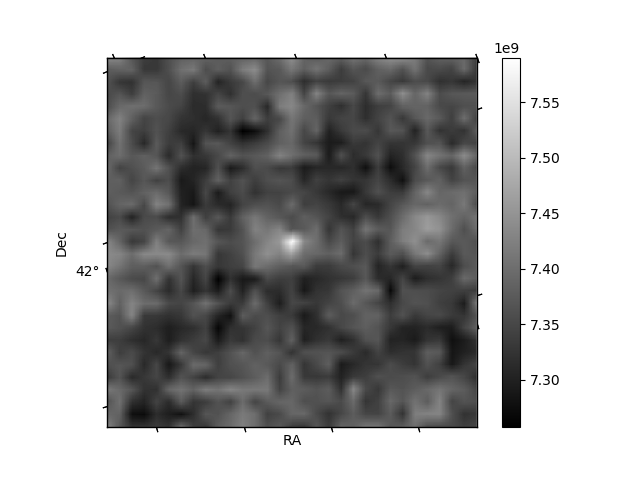
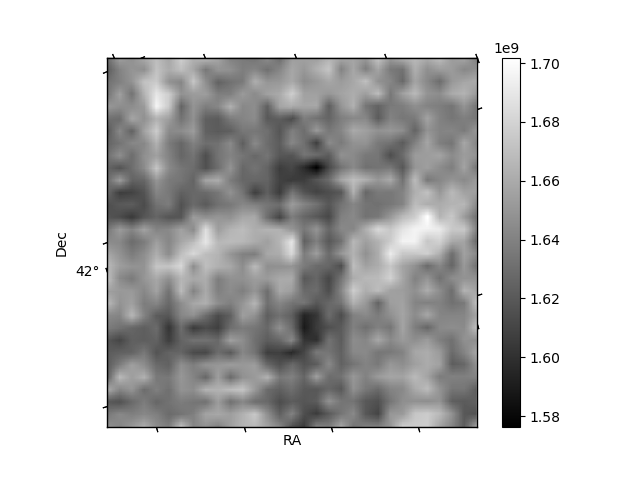
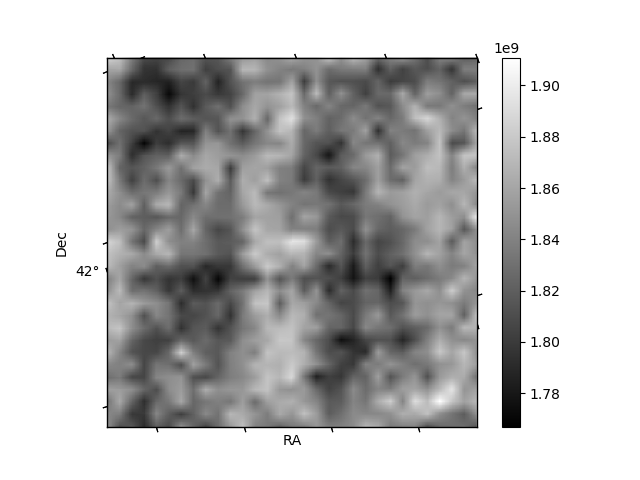
Histogram calculated using DETX and DETY for each event in the final _common_clean file
| Quadrant A |  |
 |
Quadrant B |
|---|---|---|---|
| Quadrant D |  |
 |
Quadrant C |
| Plot type | Count rate plots | Images |
|---|---|---|
| Comparison with Poisson distribution Blue bars denote a histogram of data divided into 1 sec bins. Red curve is a Poisson curve with rate = median count rate of data. |
 |
 |
| Quadrant-wise count rates Data is divided into 100 sec bins |
 |
|
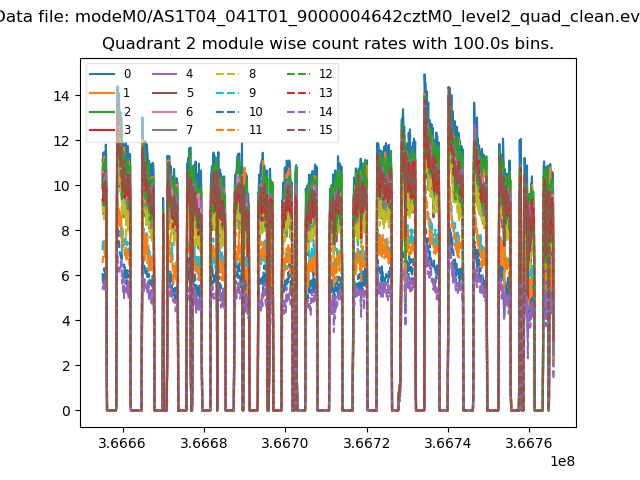
| Module-wise count rates for Quadrant A Data is divided into 100 sec bins |
 |
 |
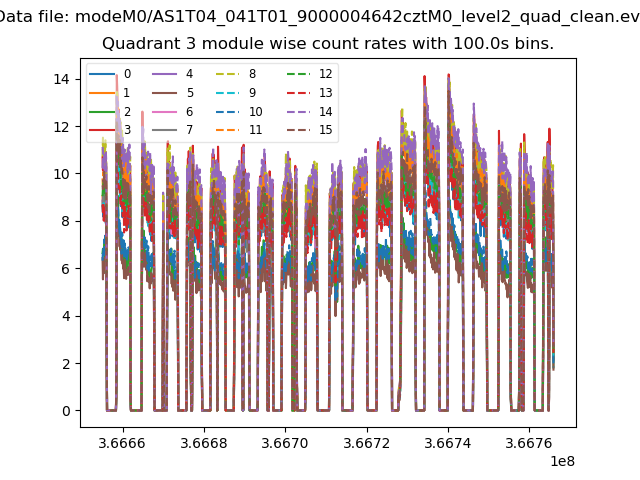
| Module-wise count rates for Quadrant B Data is divided into 100 sec bins |
 |
 |
| Module-wise count rates for Quadrant C Data is divided into 100 sec bins |
 |
 |
| Module-wise count rates for Quadrant D Data is divided into 100 sec bins |
 |
 |
| Parameter | Plot |
|---|---|
| CZT HV Monitor |  |
| D_VDD |  |
| Temperature 1 |  |
| Veto HV Monitor |  |
| Veto LLD | 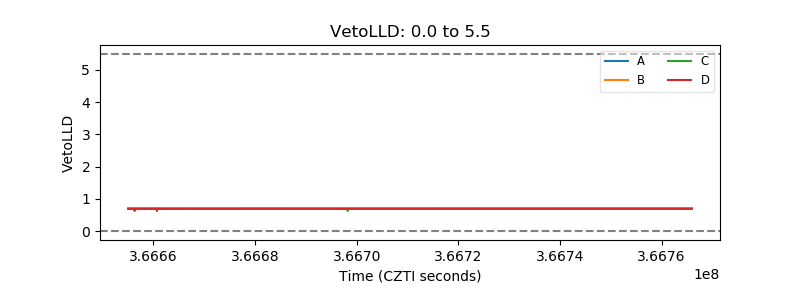 |
| Alpha Counter |  |
| _CPM_Rate |  |
| CZT Counter |  |
| +2.5 Volts monitor |  |
| +5 Volts monitor |  |
| _ROLL_ROT |  |
| _Roll_DEC |  |
| _Roll_RA | 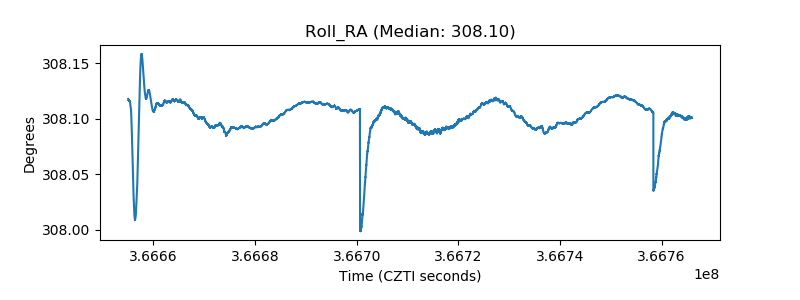 |
| Veto Counter | 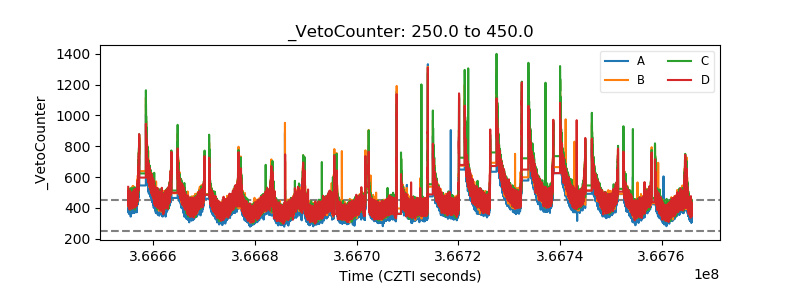 |