| Param | Original file | Final file |
|---|---|---|
| Filename | modeM0/AS1T04_036T01_9000004640cztM0_level2_bc.evt | modeM0/AS1T04_036T01_9000004640cztM0_level2_quad_clean.evt |
| Size (bytes) | 495,918,720 | 163,578,240 |
| Size | 472.9 MB | 156.0 MB |
| Events in quadrant A | 3,042,511 | 1,112,602 |
| Events in quadrant B | 4,875,781 | 1,120,693 |
| Events in quadrant C | 2,560,863 | 1,065,734 |
| Events in quadrant D | 3,913,795 | 1,023,566 |
| Mode M9 | |||
|---|---|---|---|
| Quadrant | BADHDUFLAG | Total packets | Discarded packets |
| A | 0 | 27 | 0 |
| B | 0 | 27 | 0 |
| C | 0 | 27 | 0 |
| D | 0 | 27 | 0 |
| Mode M0 | |||
|---|---|---|---|
| Quadrant | BADHDUFLAG | Total packets | Discarded packets |
| A | 0 | 23475 | 0 |
| B | 0 | 28528 | 0 |
| C | 0 | 21790 | 0 |
| D | 0 | 27177 | 0 |
| Mode SS | |||
|---|---|---|---|
| Quadrant | BADHDUFLAG | Total packets | Discarded packets |
| A | 0 | 184 | 0 |
| B | 0 | 184 | 0 |
| C | 0 | 184 | 0 |
| D | 0 | 184 | 0 |
| Quadrant | Total seconds | Saturated seconds | Saturation percentage |
|---|---|---|---|
| A | 9114 | 497 | 5.453149% |
| B | 9114 | 297 | 3.258723% |
| C | 9114 | 376 | 4.125521% |
| D | 9114 | 617 | 6.769805% |
Noise dominated data is calculated using 1-second bins in cleaned event files. If a bin has >2000 counts, and if more than 50% of those come from <1% of pixels, then it is considered to be noise-dominated and hence unusable.
| Quadrant | # 1 sec bins | Bins with >0 counts | Bins with >2000 counts | High rate bins dominated by noise | Noise dominated (total time) | Noise dominated (detector-on time) | Marked lightcurve |
|---|---|---|---|---|---|---|---|
| A | 11714 | 9115 | 12 | 12 | 0.10% | 0.13% |  |
| B | 11714 | 9114 | 0 | 0 | 0.00% | 0.00% |  |
| C | 11714 | 9114 | 1 | 1 | 0.01% | 0.01% | 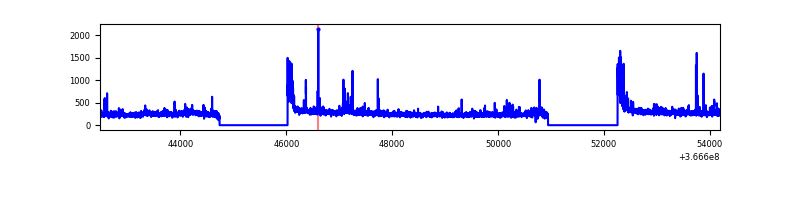 |
| D | 11714 | 9114 | 15 | 15 | 0.13% | 0.16% |  |
Top three noisy pixels from each quadrant. If the there are fewer than three noisy pixels in the level2.evt file, extra rows are filled as -1
| Pixel properties | Quadrant properties | ||||||
|---|---|---|---|---|---|---|---|
| Quadrant | DetID | PixID | Counts | Sigma | Mean | Median | Sigma |
| A | 0 | 13 | 714459 | 5642.96 | 597 | 590 | 126.5 |
| A | 13 | 254 | 17253 | 131.71 | 597 | 590 | 126.5 |
| A | 13 | 6 | 13838 | 104.72 | 597 | 590 | 126.5 |
| B | 6 | 159 | 2387627 | 21429.43 | 596 | 586 | 111.4 |
| B | 5 | 172 | 53331 | 473.51 | 596 | 586 | 111.4 |
| B | 0 | 229 | 35076 | 309.63 | 596 | 586 | 111.4 |
| C | 0 | 10 | 241662 | 1831.92 | 567 | 568 | 131.6 |
| C | 10 | 22 | 34529 | 258.05 | 567 | 568 | 131.6 |
| C | 4 | 175 | 30700 | 228.95 | 567 | 568 | 131.6 |
| D | 8 | 195 | 822752 | 6499.44 | 575 | 561 | 126.5 |
| D | 12 | 218 | 332940 | 2627.46 | 575 | 561 | 126.5 |
| D | 13 | 249 | 301334 | 2377.62 | 575 | 561 | 126.5 |
Histogram calculated using DETX and DETY for each event in the final _common_clean file
| Quadrant A | 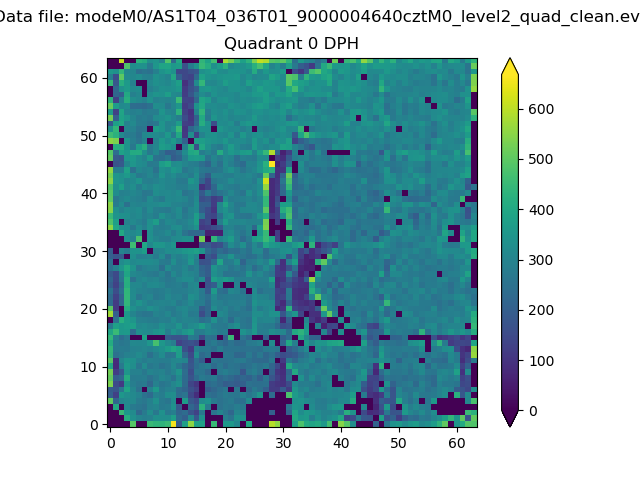 |
 |
Quadrant B |
|---|---|---|---|
| Quadrant D | 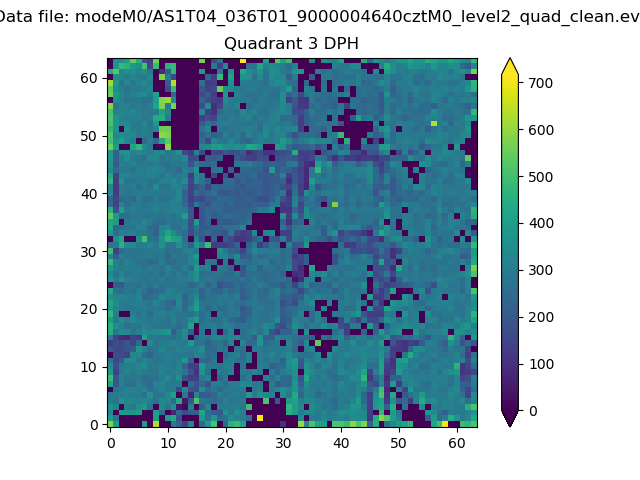 |
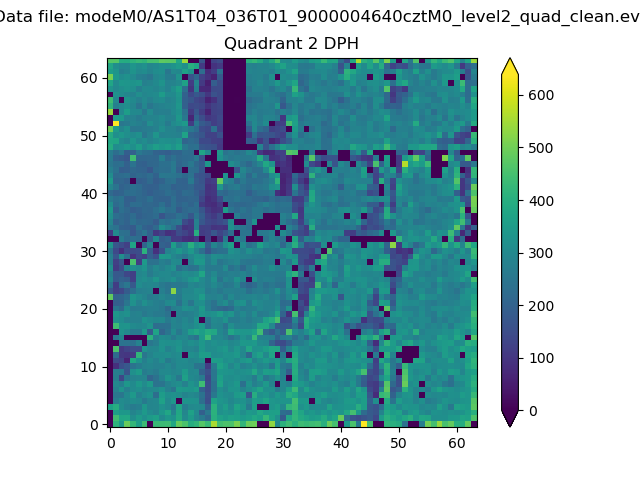 |
Quadrant C |
| Plot type | Count rate plots | Images |
|---|---|---|
| Comparison with Poisson distribution Blue bars denote a histogram of data divided into 1 sec bins. Red curve is a Poisson curve with rate = median count rate of data. |
 |
 |
| Quadrant-wise count rates Data is divided into 100 sec bins |
 |
|
| Module-wise count rates for Quadrant A Data is divided into 100 sec bins |
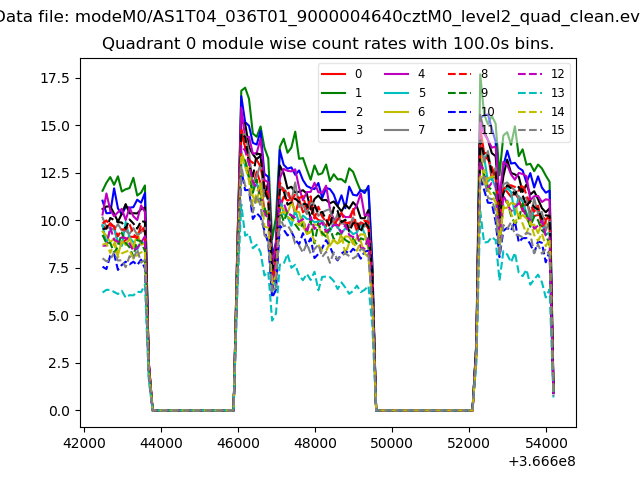 |
 |
| Module-wise count rates for Quadrant B Data is divided into 100 sec bins |
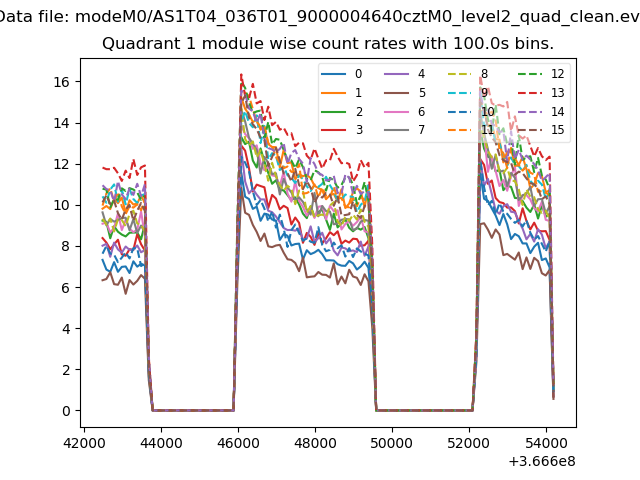 |
 |
| Module-wise count rates for Quadrant C Data is divided into 100 sec bins |
 |
 |
| Module-wise count rates for Quadrant D Data is divided into 100 sec bins |
 |
 |
| Parameter | Plot |
|---|---|
| CZT HV Monitor |  |
| D_VDD |  |
| Temperature 1 |  |
| Veto HV Monitor |  |
| Veto LLD |  |
| Alpha Counter |  |
| _CPM_Rate |  |
| CZT Counter |  |
| +2.5 Volts monitor |  |
| +5 Volts monitor |  |
| _ROLL_ROT |  |
| _Roll_DEC |  |
| _Roll_RA | 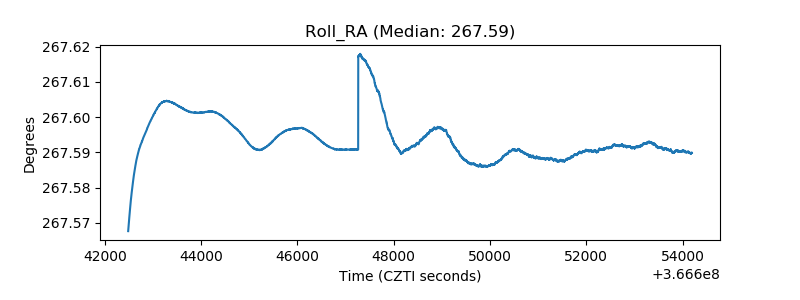 |
| Veto Counter |  |