| Param | Original file | Final file |
|---|---|---|
| Filename | modeM0/AS1A10_109T01_9000004638cztM0_level2_bc.evt | modeM0/AS1A10_109T01_9000004638cztM0_level2_quad_clean.evt |
| Size (bytes) | 4,116,827,520 | 1,315,969,920 |
| Size | 3.8 GB | 1.2 GB |
| Events in quadrant A | 22,685,591 | 8,759,908 |
| Events in quadrant B | 42,234,456 | 8,727,921 |
| Events in quadrant C | 23,059,984 | 8,421,011 |
| Events in quadrant D | 30,989,617 | 8,190,898 |
| Mode M0 | |||
|---|---|---|---|
| Quadrant | BADHDUFLAG | Total packets | Discarded packets |
| A | 0 | 191239 | 0 |
| B | 0 | 258768 | 0 |
| C | 0 | 197259 | 0 |
| D | 0 | 216100 | 0 |
| Mode M9 | |||
|---|---|---|---|
| Quadrant | BADHDUFLAG | Total packets | Discarded packets |
| A | 0 | 146 | 0 |
| B | 0 | 146 | 0 |
| C | 0 | 146 | 0 |
| D | 0 | 146 | 0 |
| Mode SS | |||
|---|---|---|---|
| Quadrant | BADHDUFLAG | Total packets | Discarded packets |
| A | 0 | 1714 | 0 |
| B | 0 | 1714 | 0 |
| C | 0 | 1714 | 0 |
| D | 0 | 1714 | 0 |
| Quadrant | Total seconds | Saturated seconds | Saturation percentage |
|---|---|---|---|
| A | 84075 | 1746 | 2.076717% |
| B | 84075 | 2019 | 2.401427% |
| C | 84075 | 2703 | 3.214987% |
| D | 84074 | 1511 | 1.797226% |
Noise dominated data is calculated using 1-second bins in cleaned event files. If a bin has >2000 counts, and if more than 50% of those come from <1% of pixels, then it is considered to be noise-dominated and hence unusable.
| Quadrant | # 1 sec bins | Bins with >0 counts | Bins with >2000 counts | High rate bins dominated by noise | Noise dominated (total time) | Noise dominated (detector-on time) | Marked lightcurve |
|---|---|---|---|---|---|---|---|
| A | 98560 | 84082 | 90 | 90 | 0.09% | 0.11% |  |
| B | 98560 | 84075 | 25 | 25 | 0.03% | 0.03% |  |
| C | 98560 | 84075 | 36 | 36 | 0.04% | 0.04% |  |
| D | 98560 | 84076 | 113 | 113 | 0.11% | 0.13% | 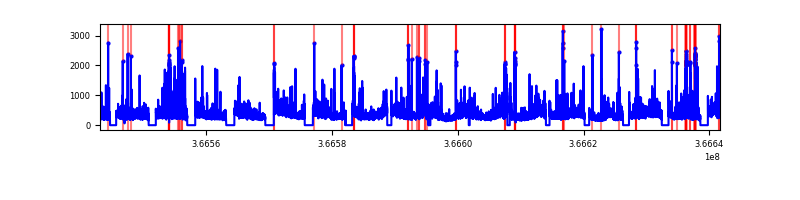 |
Top three noisy pixels from each quadrant. If the there are fewer than three noisy pixels in the level2.evt file, extra rows are filled as -1
| Pixel properties | Quadrant properties | ||||||
|---|---|---|---|---|---|---|---|
| Quadrant | DetID | PixID | Counts | Sigma | Mean | Median | Sigma |
| A | 0 | 13 | 3102705 | 2814.07 | 5043 | 4971 | 1100.8 |
| A | 13 | 254 | 145333 | 127.51 | 5043 | 4971 | 1100.8 |
| A | 14 | 238 | 105414 | 91.25 | 5043 | 4971 | 1100.8 |
| B | 6 | 159 | 21489215 | 22288.65 | 5034 | 4962 | 963.9 |
| B | 0 | 229 | 538847 | 553.87 | 5034 | 4962 | 963.9 |
| B | 4 | 80 | 320297 | 327.14 | 5034 | 4962 | 963.9 |
| C | 0 | 10 | 2732437 | 2353.25 | 4839 | 4864 | 1159.1 |
| C | 3 | 233 | 1201549 | 1032.46 | 4839 | 4864 | 1159.1 |
| C | 4 | 175 | 174244 | 146.13 | 4839 | 4864 | 1159.1 |
| D | 8 | 195 | 9065336 | 7981.47 | 4937 | 4807 | 1135.2 |
| D | 12 | 218 | 1774782 | 1559.18 | 4937 | 4807 | 1135.2 |
| D | 2 | 250 | 540807 | 472.16 | 4937 | 4807 | 1135.2 |
Histogram calculated using DETX and DETY for each event in the final _common_clean file
| Quadrant A |  |
 |
Quadrant B |
|---|---|---|---|
| Quadrant D |  |
 |
Quadrant C |
| Plot type | Count rate plots | Images |
|---|---|---|
| Comparison with Poisson distribution Blue bars denote a histogram of data divided into 1 sec bins. Red curve is a Poisson curve with rate = median count rate of data. |
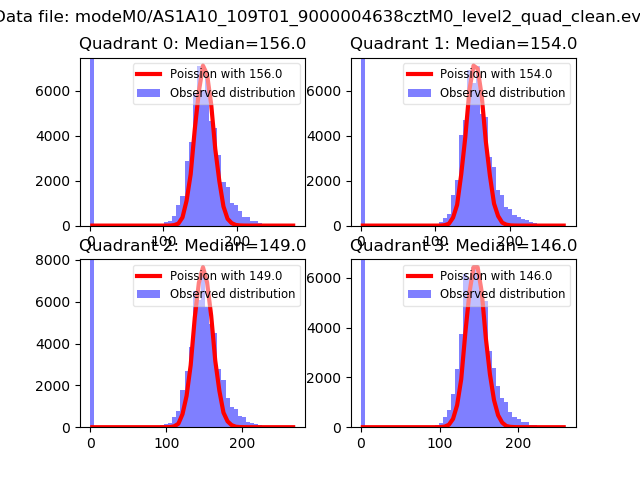 |
 |
| Quadrant-wise count rates Data is divided into 100 sec bins |
 |
|
| Module-wise count rates for Quadrant A Data is divided into 100 sec bins |
 |
 |
| Module-wise count rates for Quadrant B Data is divided into 100 sec bins |
 |
 |
| Module-wise count rates for Quadrant C Data is divided into 100 sec bins |
 |
 |
| Module-wise count rates for Quadrant D Data is divided into 100 sec bins |
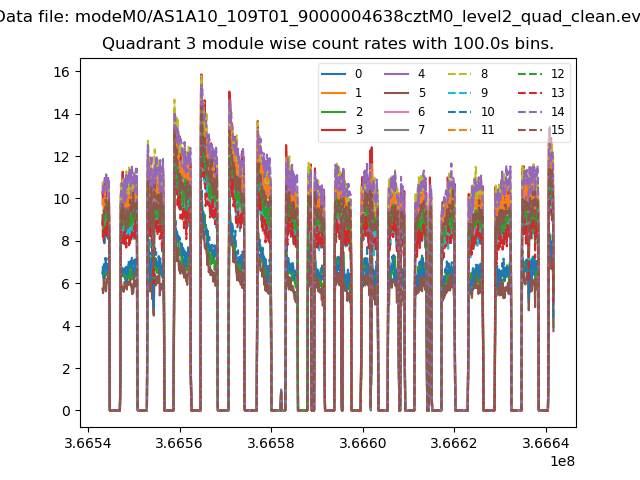 |
 |
| Parameter | Plot |
|---|---|
| CZT HV Monitor |  |
| D_VDD |  |
| Temperature 1 | 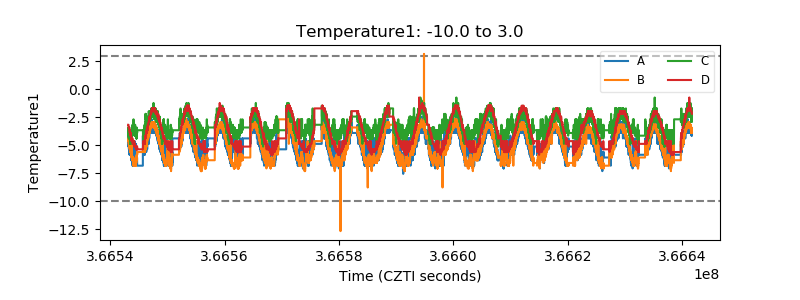 |
| Veto HV Monitor |  |
| Veto LLD | 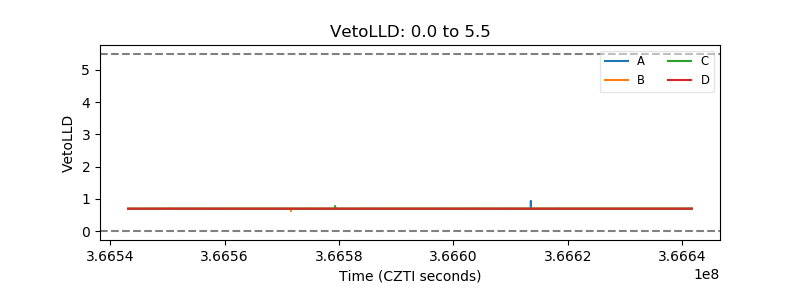 |
| Alpha Counter |  |
| _CPM_Rate |  |
| CZT Counter |  |
| +2.5 Volts monitor |  |
| +5 Volts monitor | 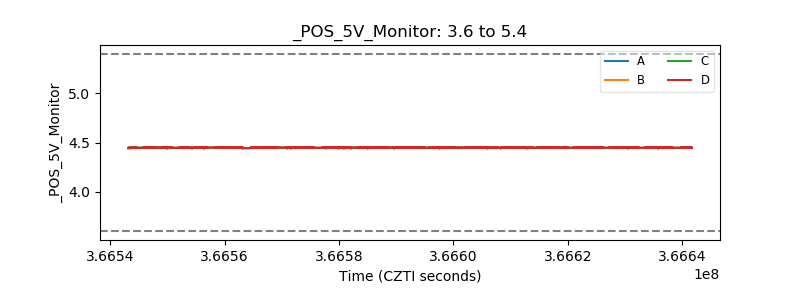 |
| _ROLL_ROT |  |
| _Roll_DEC |  |
| _Roll_RA |  |
| Veto Counter |  |