| Param | Original file | Final file |
|---|---|---|
| Filename | modeM0/AS1A10_059T02_9000004636cztM0_level2_bc.evt | modeM0/AS1A10_059T02_9000004636cztM0_level2_quad_clean.evt |
| Size (bytes) | 2,509,885,440 | 493,439,040 |
| Size | 2.3 GB | 470.6 MB |
| Events in quadrant A | 21,425,158 | 2,776,452 |
| Events in quadrant B | 19,260,482 | 3,315,801 |
| Events in quadrant C | 17,476,475 | 3,135,812 |
| Events in quadrant D | 15,286,689 | 3,126,132 |
| Mode M9 | |||
|---|---|---|---|
| Quadrant | BADHDUFLAG | Total packets | Discarded packets |
| A | 0 | 36 | 0 |
| B | 0 | 36 | 0 |
| C | 0 | 36 | 0 |
| D | 0 | 36 | 0 |
| Mode SS | |||
|---|---|---|---|
| Quadrant | BADHDUFLAG | Total packets | Discarded packets |
| A | 0 | 766 | 0 |
| B | 0 | 766 | 0 |
| C | 0 | 766 | 0 |
| D | 0 | 766 | 0 |
| Mode M0 | |||
|---|---|---|---|
| Quadrant | BADHDUFLAG | Total packets | Discarded packets |
| A | 0 | 152994 | 0 |
| B | 0 | 118485 | 0 |
| C | 0 | 115443 | 0 |
| D | 0 | 101909 | 0 |
| Quadrant | Total seconds | Saturated seconds | Saturation percentage |
|---|---|---|---|
| A | 37653 | 12432 | 33.017289% |
| B | 37653 | 1371 | 3.641144% |
| C | 37653 | 3603 | 9.568959% |
| D | 37653 | 1504 | 3.994370% |
Noise dominated data is calculated using 1-second bins in cleaned event files. If a bin has >2000 counts, and if more than 50% of those come from <1% of pixels, then it is considered to be noise-dominated and hence unusable.
| Quadrant | # 1 sec bins | Bins with >0 counts | Bins with >2000 counts | High rate bins dominated by noise | Noise dominated (total time) | Noise dominated (detector-on time) | Marked lightcurve |
|---|---|---|---|---|---|---|---|
| A | 41358 | 37623 | 299 | 299 | 0.72% | 0.79% |  |
| B | 41358 | 37655 | 33 | 33 | 0.08% | 0.09% |  |
| C | 41358 | 37656 | 170 | 170 | 0.41% | 0.45% |  |
| D | 41358 | 37655 | 145 | 145 | 0.35% | 0.39% |  |
Top three noisy pixels from each quadrant. If the there are fewer than three noisy pixels in the level2.evt file, extra rows are filled as -1
| Pixel properties | Quadrant properties | ||||||
|---|---|---|---|---|---|---|---|
| Quadrant | DetID | PixID | Counts | Sigma | Mean | Median | Sigma |
| A | 0 | 13 | 15246903 | 43556.71 | 1591 | 1565 | 350.0 |
| A | 13 | 254 | 56639 | 157.35 | 1591 | 1565 | 350.0 |
| A | 14 | 238 | 15041 | 38.5 | 1591 | 1565 | 350.0 |
| B | 6 | 159 | 9993094 | 26667.82 | 1942 | 1893 | 374.7 |
| B | 5 | 172 | 619803 | 1649.28 | 1942 | 1893 | 374.7 |
| B | 10 | 245 | 520537 | 1384.33 | 1942 | 1893 | 374.7 |
| C | 3 | 233 | 5692112 | 13330.36 | 1811 | 1807 | 426.9 |
| C | 0 | 10 | 4220888 | 9883.81 | 1811 | 1807 | 426.9 |
| C | 10 | 22 | 405492 | 945.69 | 1811 | 1807 | 426.9 |
| D | 8 | 195 | 4502905 | 10205.4 | 1891 | 1827 | 441.0 |
| D | 12 | 218 | 962827 | 2178.9 | 1891 | 1827 | 441.0 |
| D | 13 | 249 | 955152 | 2161.5 | 1891 | 1827 | 441.0 |
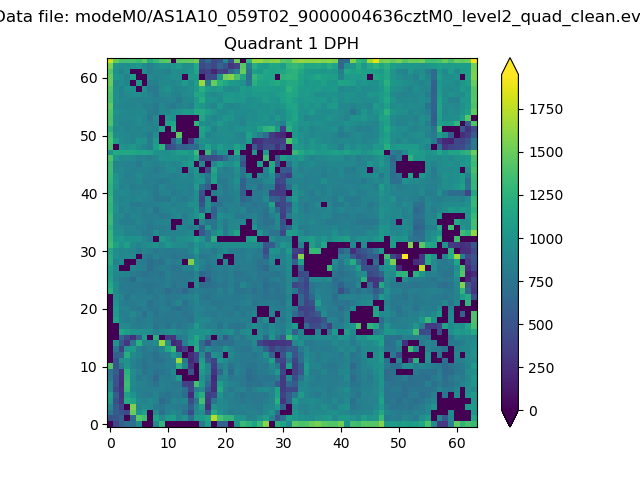
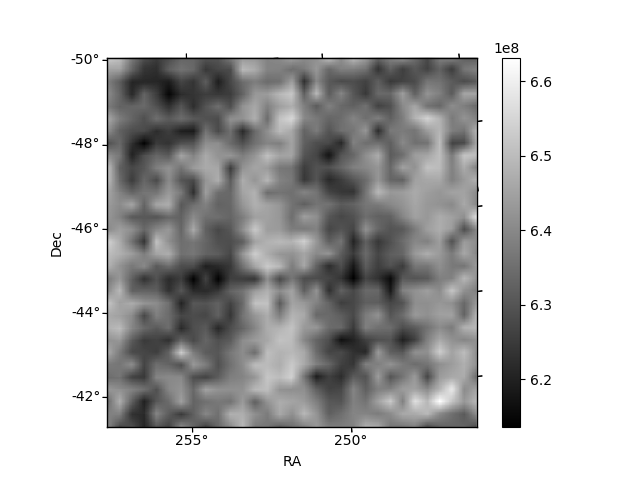
Histogram calculated using DETX and DETY for each event in the final _common_clean file
| Quadrant A |  |
 |
Quadrant B |
|---|---|---|---|
| Quadrant D | 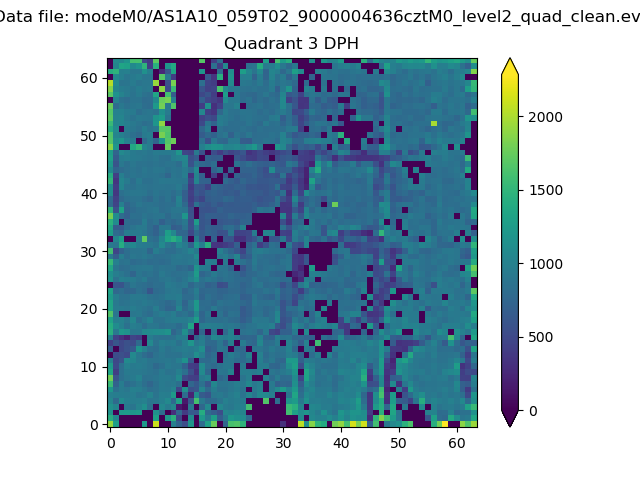 |
 |
Quadrant C |
| Plot type | Count rate plots | Images |
|---|---|---|
| Comparison with Poisson distribution Blue bars denote a histogram of data divided into 1 sec bins. Red curve is a Poisson curve with rate = median count rate of data. |
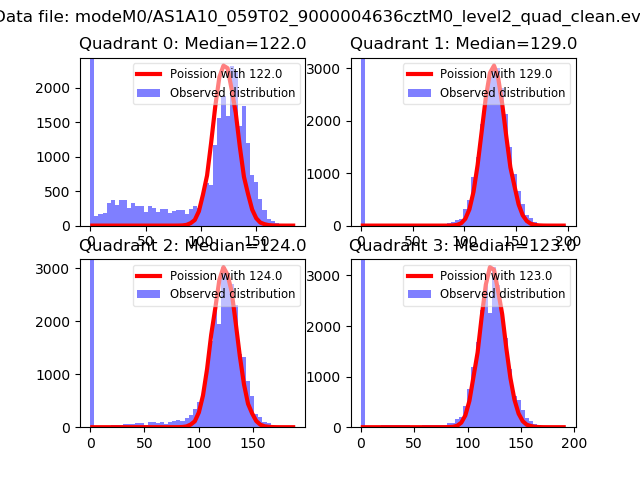 |
 |
| Quadrant-wise count rates Data is divided into 100 sec bins |
 |
|
| Module-wise count rates for Quadrant A Data is divided into 100 sec bins |
 |
 |
| Module-wise count rates for Quadrant B Data is divided into 100 sec bins |
 |
 |
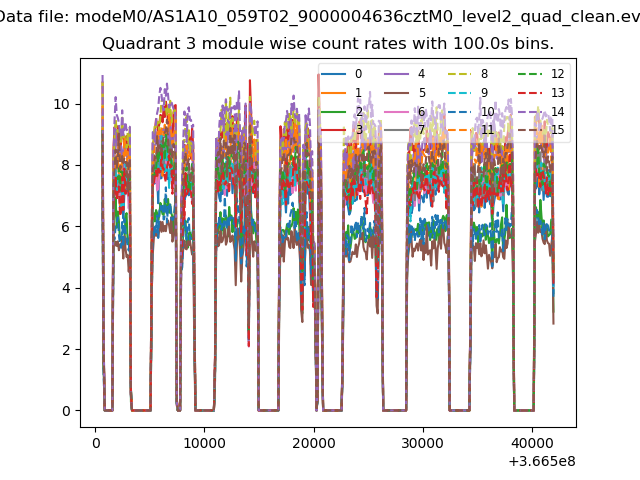
| Module-wise count rates for Quadrant C Data is divided into 100 sec bins |
 |
 |
| Module-wise count rates for Quadrant D Data is divided into 100 sec bins |
 |
 |
| Parameter | Plot |
|---|---|
| CZT HV Monitor |  |
| D_VDD |  |
| Temperature 1 |  |
| Veto HV Monitor |  |
| Veto LLD |  |
| Alpha Counter |  |
| _CPM_Rate | 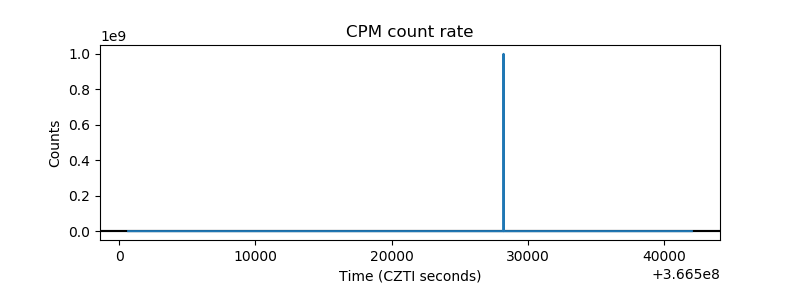 |
| CZT Counter |  |
| +2.5 Volts monitor |  |
| +5 Volts monitor |  |
| _ROLL_ROT |  |
| _Roll_DEC |  |
| _Roll_RA | 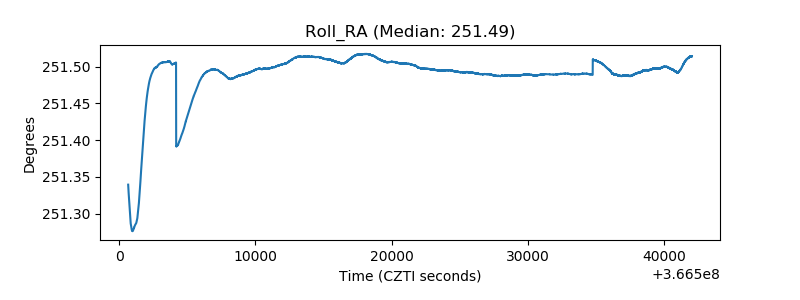 |
| Veto Counter | 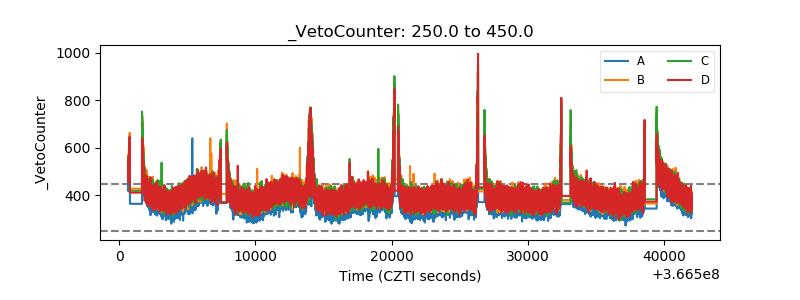 |