| Param | Original file | Final file |
|---|---|---|
| Filename | modeM0/AS1A10_059T01_9000004634cztM0_level2_bc.evt | modeM0/AS1A10_059T01_9000004634cztM0_level2_quad_clean.evt |
| Size (bytes) | 2,739,700,800 | 510,874,560 |
| Size | 2.6 GB | 487.2 MB |
| Events in quadrant A | 22,436,342 | 3,150,379 |
| Events in quadrant B | 20,952,659 | 3,455,881 |
| Events in quadrant C | 20,008,266 | 3,192,097 |
| Events in quadrant D | 17,208,991 | 3,277,493 |
| Mode M9 | |||
|---|---|---|---|
| Quadrant | BADHDUFLAG | Total packets | Discarded packets |
| A | 0 | 74 | 0 |
| B | 0 | 74 | 0 |
| C | 0 | 74 | 0 |
| D | 0 | 74 | 0 |
| Mode SS | |||
|---|---|---|---|
| Quadrant | BADHDUFLAG | Total packets | Discarded packets |
| A | 0 | 710 | 0 |
| B | 0 | 710 | 0 |
| C | 0 | 710 | 0 |
| D | 0 | 710 | 0 |
| Mode M0 | |||
|---|---|---|---|
| Quadrant | BADHDUFLAG | Total packets | Discarded packets |
| A | 0 | 139467 | 0 |
| B | 0 | 120558 | 0 |
| C | 0 | 120514 | 0 |
| D | 0 | 104209 | 0 |
| Quadrant | Total seconds | Saturated seconds | Saturation percentage |
|---|---|---|---|
| A | 34835 | 8720 | 25.032295% |
| B | 34835 | 2604 | 7.475240% |
| C | 34835 | 5679 | 16.302569% |
| D | 34835 | 1586 | 4.552892% |
Noise dominated data is calculated using 1-second bins in cleaned event files. If a bin has >2000 counts, and if more than 50% of those come from <1% of pixels, then it is considered to be noise-dominated and hence unusable.
| Quadrant | # 1 sec bins | Bins with >0 counts | Bins with >2000 counts | High rate bins dominated by noise | Noise dominated (total time) | Noise dominated (detector-on time) | Marked lightcurve |
|---|---|---|---|---|---|---|---|
| A | 42329 | 34824 | 621 | 621 | 1.47% | 1.78% |  |
| B | 42329 | 34834 | 170 | 170 | 0.40% | 0.49% | 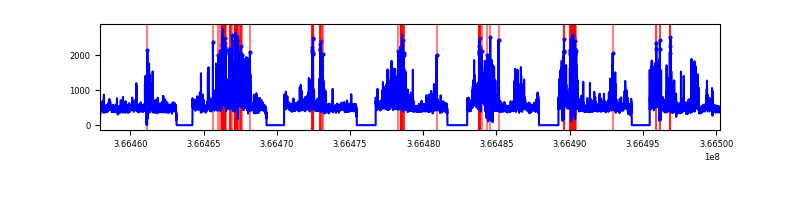 |
| C | 42330 | 34834 | 757 | 757 | 1.79% | 2.17% |  |
| D | 42329 | 34833 | 83 | 83 | 0.20% | 0.24% | 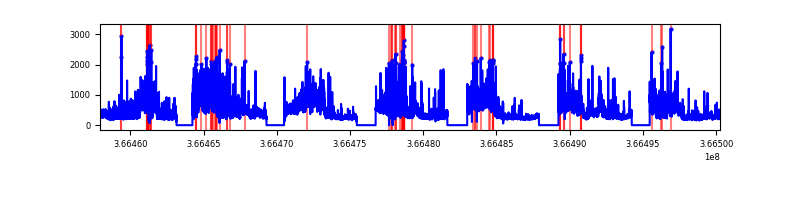 |
Top three noisy pixels from each quadrant. If the there are fewer than three noisy pixels in the level2.evt file, extra rows are filled as -1
| Pixel properties | Quadrant properties | ||||||
|---|---|---|---|---|---|---|---|
| Quadrant | DetID | PixID | Counts | Sigma | Mean | Median | Sigma |
| A | 0 | 13 | 15353121 | 38927.78 | 1825 | 1802 | 394.4 |
| A | 13 | 254 | 56028 | 137.51 | 1825 | 1802 | 394.4 |
| A | 14 | 238 | 38597 | 93.3 | 1825 | 1802 | 394.4 |
| B | 6 | 159 | 9370173 | 24491.28 | 2035 | 1997 | 382.5 |
| B | 5 | 172 | 1999615 | 5222.39 | 2035 | 1997 | 382.5 |
| B | 10 | 245 | 949539 | 2477.16 | 2035 | 1997 | 382.5 |
| C | 3 | 233 | 7899937 | 18356.95 | 1844 | 1848 | 430.3 |
| C | 0 | 10 | 4137249 | 9611.61 | 1844 | 1848 | 430.3 |
| C | 10 | 22 | 709658 | 1645.11 | 1844 | 1848 | 430.3 |
| D | 8 | 195 | 6205852 | 13855.62 | 1992 | 1940 | 447.8 |
| D | 12 | 218 | 1845270 | 4116.83 | 1992 | 1940 | 447.8 |
| D | 12 | 233 | 466748 | 1038.09 | 1992 | 1940 | 447.8 |
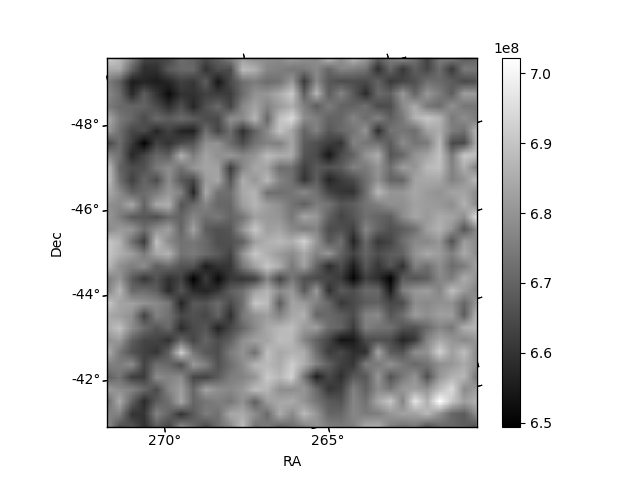
Histogram calculated using DETX and DETY for each event in the final _common_clean file
| Quadrant A |  |
 |
Quadrant B |
|---|---|---|---|
| Quadrant D |  |
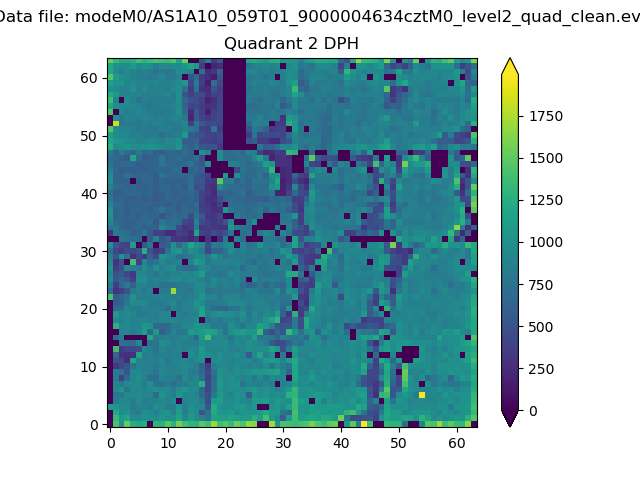 |
Quadrant C |
| Plot type | Count rate plots | Images |
|---|---|---|
| Comparison with Poisson distribution Blue bars denote a histogram of data divided into 1 sec bins. Red curve is a Poisson curve with rate = median count rate of data. |
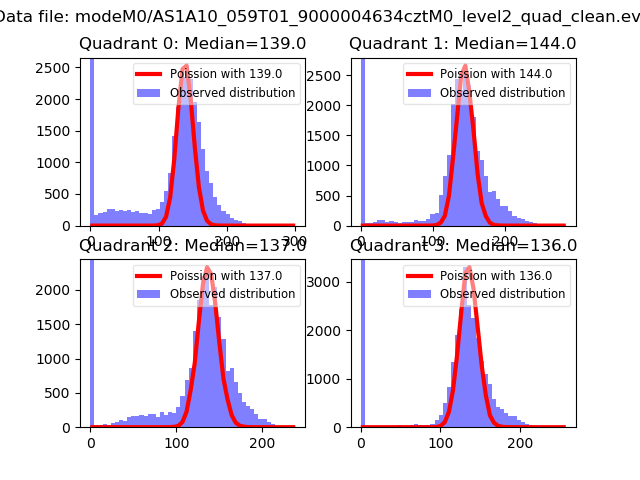 |
 |
| Quadrant-wise count rates Data is divided into 100 sec bins |
 |
|
| Module-wise count rates for Quadrant A Data is divided into 100 sec bins |
 |
 |
| Module-wise count rates for Quadrant B Data is divided into 100 sec bins |
 |
 |
| Module-wise count rates for Quadrant C Data is divided into 100 sec bins |
 |
 |
| Module-wise count rates for Quadrant D Data is divided into 100 sec bins |
 |
 |
| Parameter | Plot |
|---|---|
| CZT HV Monitor |  |
| D_VDD |  |
| Temperature 1 |  |
| Veto HV Monitor |  |
| Veto LLD |  |
| Alpha Counter |  |
| _CPM_Rate |  |
| CZT Counter |  |
| +2.5 Volts monitor | 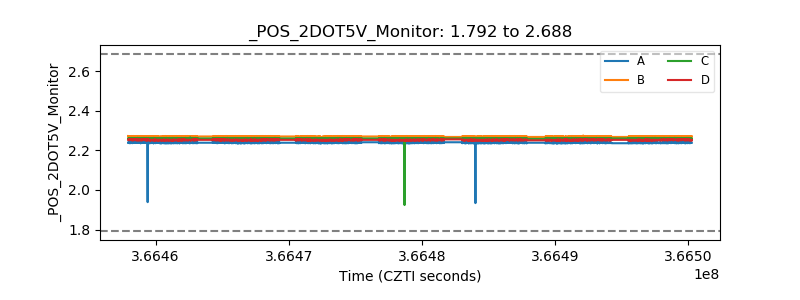 |
| +5 Volts monitor | 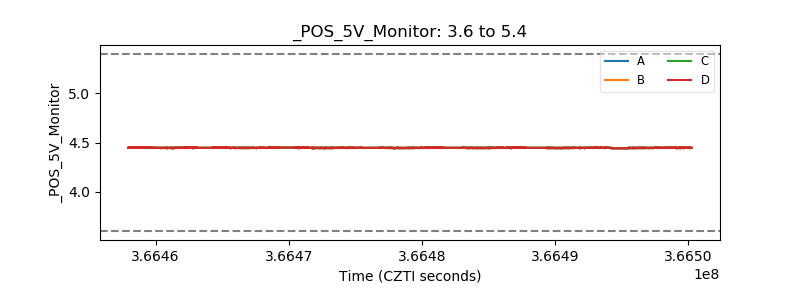 |
| _ROLL_ROT |  |
| _Roll_DEC |  |
| _Roll_RA |  |
| Veto Counter |  |