| Param | Original file | Final file |
|---|---|---|
| Filename | modeM0/AS1T04_034T01_9000004632cztM0_level2_bc.evt | modeM0/AS1T04_034T01_9000004632cztM0_level2_quad_clean.evt |
| Size (bytes) | 17,227,062,720 | 3,909,130,560 |
| Size | 16.0 GB | 3.6 GB |
| Events in quadrant A | 127,781,887 | 24,286,225 |
| Events in quadrant B | 170,646,942 | 25,131,511 |
| Events in quadrant C | 93,191,615 | 24,623,781 |
| Events in quadrant D | 110,219,382 | 24,270,001 |
| Mode M9 | |||
|---|---|---|---|
| Quadrant | BADHDUFLAG | Total packets | Discarded packets |
| A | 0 | 458 | 0 |
| B | 0 | 459 | 0 |
| C | 0 | 459 | 0 |
| D | 0 | 459 | 0 |
| Mode SS | |||
|---|---|---|---|
| Quadrant | BADHDUFLAG | Total packets | Discarded packets |
| A | 0 | 5972 | 0 |
| B | 0 | 5972 | 0 |
| C | 0 | 5972 | 0 |
| D | 0 | 5972 | 0 |
| Mode M0 | |||
|---|---|---|---|
| Quadrant | BADHDUFLAG | Total packets | Discarded packets |
| A | 0 | 882315 | 0 |
| B | 0 | 1004957 | 0 |
| C | 0 | 741977 | 0 |
| D | 0 | 764106 | 0 |
| Quadrant | Total seconds | Saturated seconds | Saturation percentage |
|---|---|---|---|
| A | 293291 | 29916 | 10.200108% |
| B | 293291 | 20109 | 6.856330% |
| C | 293290 | 13780 | 4.698421% |
| D | 293290 | 6919 | 2.359099% |
Noise dominated data is calculated using 1-second bins in cleaned event files. If a bin has >2000 counts, and if more than 50% of those come from <1% of pixels, then it is considered to be noise-dominated and hence unusable.
| Quadrant | # 1 sec bins | Bins with >0 counts | Bins with >2000 counts | High rate bins dominated by noise | Noise dominated (total time) | Noise dominated (detector-on time) | Marked lightcurve |
|---|---|---|---|---|---|---|---|
| A | 343302 | 293287 | 1885 | 1885 | 0.55% | 0.64% |  |
| B | 343302 | 293296 | 269 | 269 | 0.08% | 0.09% | 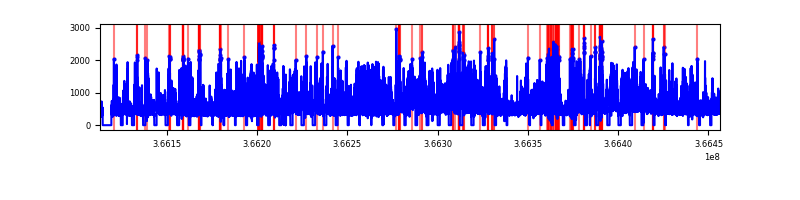 |
| C | 343303 | 293303 | 632 | 632 | 0.18% | 0.22% |  |
| D | 343302 | 293297 | 247 | 247 | 0.07% | 0.08% |  |
Top three noisy pixels from each quadrant. If the there are fewer than three noisy pixels in the level2.evt file, extra rows are filled as -1
| Pixel properties | Quadrant properties | ||||||
|---|---|---|---|---|---|---|---|
| Quadrant | DetID | PixID | Counts | Sigma | Mean | Median | Sigma |
| A | 0 | 13 | 64930959 | 19192.11 | 15964 | 15735 | 3382.4 |
| A | 12 | 96 | 833185 | 241.68 | 15964 | 15735 | 3382.4 |
| A | 13 | 254 | 500763 | 143.4 | 15964 | 15735 | 3382.4 |
| B | 6 | 159 | 76614151 | 25060.71 | 16406 | 16030 | 3056.5 |
| B | 4 | 80 | 20640294 | 6747.67 | 16406 | 16030 | 3056.5 |
| B | 5 | 255 | 3469688 | 1129.94 | 16406 | 16030 | 3056.5 |
| C | 0 | 10 | 19598223 | 5249.91 | 15947 | 15939 | 3730.0 |
| C | 3 | 233 | 5326556 | 1423.75 | 15947 | 15939 | 3730.0 |
| C | 10 | 22 | 4250802 | 1135.34 | 15947 | 15939 | 3730.0 |
| D | 8 | 195 | 32519918 | 8838.76 | 16443 | 15970 | 3677.4 |
| D | 12 | 233 | 5969996 | 1619.07 | 16443 | 15970 | 3677.4 |
| D | 12 | 227 | 4019033 | 1088.55 | 16443 | 15970 | 3677.4 |
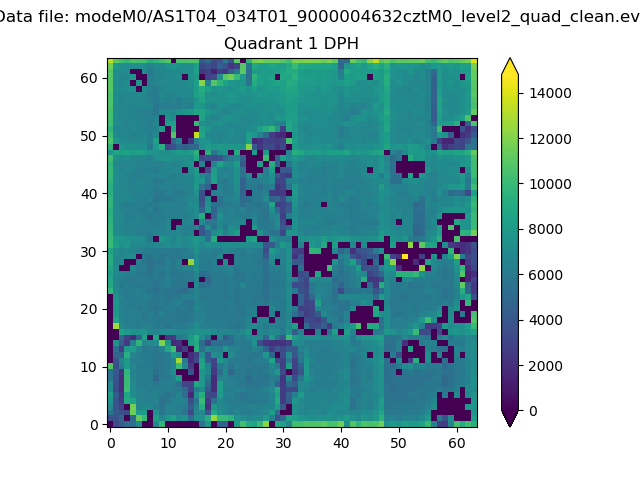
Histogram calculated using DETX and DETY for each event in the final _common_clean file
| Quadrant A |  |
 |
Quadrant B |
|---|---|---|---|
| Quadrant D |  |
 |
Quadrant C |
| Plot type | Count rate plots | Images |
|---|---|---|
| Comparison with Poisson distribution Blue bars denote a histogram of data divided into 1 sec bins. Red curve is a Poisson curve with rate = median count rate of data. |
 |
 |
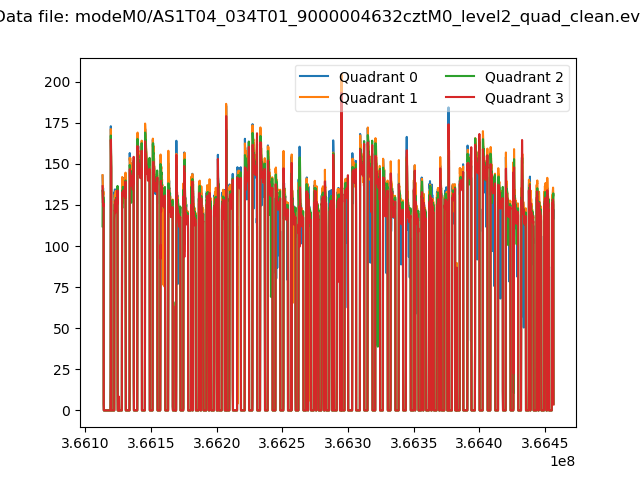
| Quadrant-wise count rates Data is divided into 100 sec bins |
 |
|
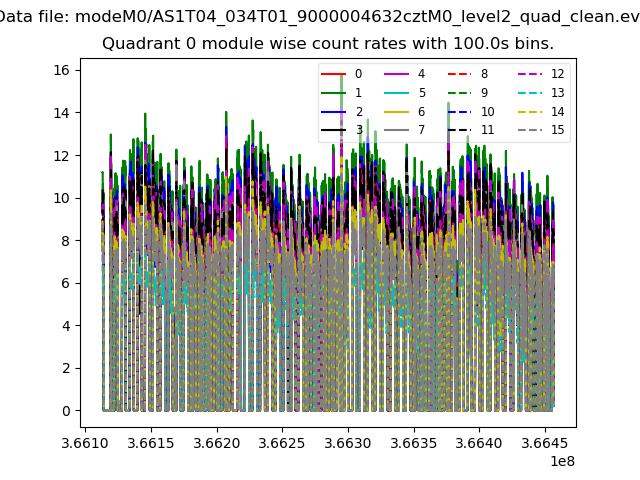
| Module-wise count rates for Quadrant A Data is divided into 100 sec bins |
 |
 |
| Module-wise count rates for Quadrant B Data is divided into 100 sec bins |
 |
 |
| Module-wise count rates for Quadrant C Data is divided into 100 sec bins |
 |
 |
| Module-wise count rates for Quadrant D Data is divided into 100 sec bins |
 |
 |
| Parameter | Plot |
|---|---|
| CZT HV Monitor |  |
| D_VDD |  |
| Temperature 1 | 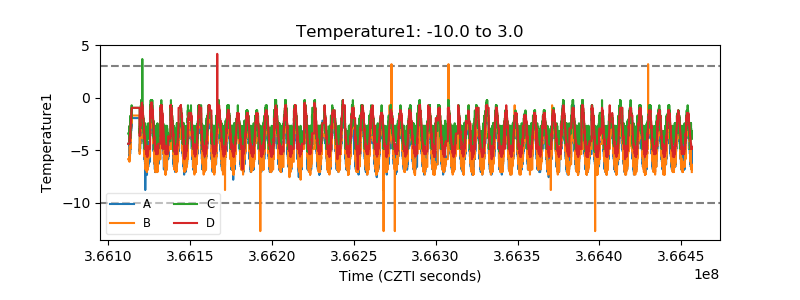 |
| Veto HV Monitor |  |
| Veto LLD |  |
| Alpha Counter |  |
| _CPM_Rate |  |
| CZT Counter |  |
| +2.5 Volts monitor |  |
| +5 Volts monitor |  |
| _ROLL_ROT |  |
| _Roll_DEC |  |
| _Roll_RA |  |
| Veto Counter |  |