| Param | Original file | Final file |
|---|---|---|
| Filename | modeM0/AS1A10_094T13_9000004628cztM0_level2_bc.evt | modeM0/AS1A10_094T13_9000004628cztM0_level2_quad_clean.evt |
| Size (bytes) | 725,754,240 | 257,918,400 |
| Size | 692.1 MB | 246.0 MB |
| Events in quadrant A | 3,874,466 | 1,687,114 |
| Events in quadrant B | 7,672,084 | 1,702,704 |
| Events in quadrant C | 4,313,524 | 1,697,547 |
| Events in quadrant D | 5,061,561 | 1,657,713 |
| Mode SS | |||
|---|---|---|---|
| Quadrant | BADHDUFLAG | Total packets | Discarded packets |
| A | 0 | 314 | 0 |
| B | 0 | 314 | 0 |
| C | 0 | 314 | 0 |
| D | 0 | 314 | 0 |
| Mode M0 | |||
|---|---|---|---|
| Quadrant | BADHDUFLAG | Total packets | Discarded packets |
| A | 0 | 34731 | 0 |
| B | 0 | 48263 | 0 |
| C | 0 | 35330 | 0 |
| D | 0 | 37202 | 0 |
| Mode M9 | |||
|---|---|---|---|
| Quadrant | BADHDUFLAG | Total packets | Discarded packets |
| A | 0 | 7 | 0 |
| B | 0 | 7 | 0 |
| C | 0 | 7 | 0 |
| D | 0 | 7 | 0 |
| Quadrant | Total seconds | Saturated seconds | Saturation percentage |
|---|---|---|---|
| A | 15461 | 443 | 2.865274% |
| B | 15461 | 456 | 2.949356% |
| C | 15461 | 419 | 2.710045% |
| D | 15461 | 371 | 2.399586% |
Noise dominated data is calculated using 1-second bins in cleaned event files. If a bin has >2000 counts, and if more than 50% of those come from <1% of pixels, then it is considered to be noise-dominated and hence unusable.
| Quadrant | # 1 sec bins | Bins with >0 counts | Bins with >2000 counts | High rate bins dominated by noise | Noise dominated (total time) | Noise dominated (detector-on time) | Marked lightcurve |
|---|---|---|---|---|---|---|---|
| A | 16176 | 15461 | 4 | 4 | 0.02% | 0.03% | 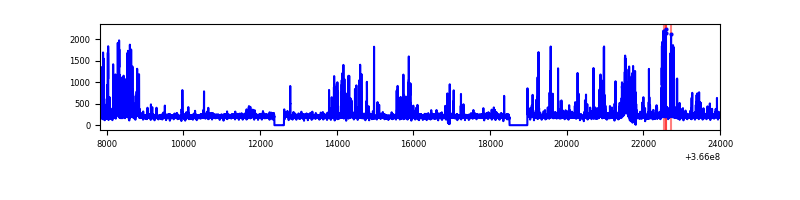 |
| B | 16176 | 15461 | 3 | 3 | 0.02% | 0.02% |  |
| C | 16176 | 15461 | 14 | 14 | 0.09% | 0.09% |  |
| D | 16176 | 15461 | 20 | 20 | 0.12% | 0.13% |  |
Top three noisy pixels from each quadrant. If the there are fewer than three noisy pixels in the level2.evt file, extra rows are filled as -1
| Pixel properties | Quadrant properties | ||||||
|---|---|---|---|---|---|---|---|
| Quadrant | DetID | PixID | Counts | Sigma | Mean | Median | Sigma |
| A | 0 | 13 | 849656 | 5027.7 | 762 | 748 | 168.8 |
| A | 4 | 48 | 45308 | 263.91 | 762 | 748 | 168.8 |
| A | 13 | 254 | 27211 | 156.73 | 762 | 748 | 168.8 |
| B | 6 | 159 | 3994091 | 26523.95 | 772 | 754 | 150.6 |
| B | 4 | 80 | 476963 | 3163.0 | 772 | 754 | 150.6 |
| B | 0 | 229 | 47524 | 310.65 | 772 | 754 | 150.6 |
| C | 3 | 233 | 836373 | 4493.17 | 758 | 754 | 186.0 |
| C | 0 | 10 | 376215 | 2018.87 | 758 | 754 | 186.0 |
| C | 10 | 22 | 145794 | 779.89 | 758 | 754 | 186.0 |
| D | 8 | 195 | 1490041 | 8210.86 | 766 | 740 | 181.4 |
| D | 13 | 249 | 359322 | 1976.95 | 766 | 740 | 181.4 |
| D | 2 | 250 | 157384 | 863.61 | 766 | 740 | 181.4 |
Histogram calculated using DETX and DETY for each event in the final _common_clean file
| Quadrant A |  |
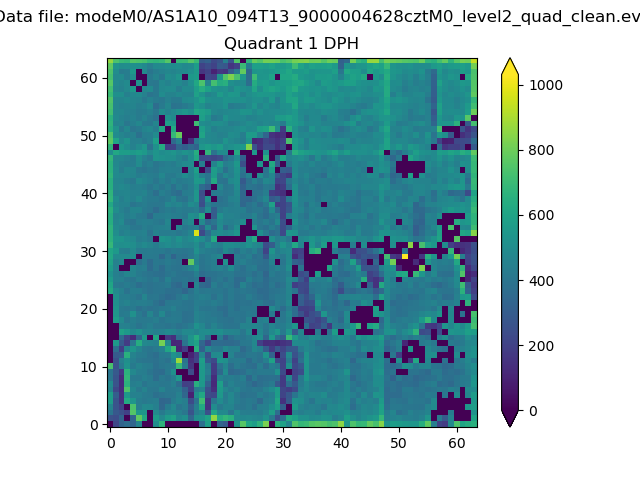 |
Quadrant B |
|---|---|---|---|
| Quadrant D |  |
 |
Quadrant C |
| Plot type | Count rate plots | Images |
|---|---|---|
| Comparison with Poisson distribution Blue bars denote a histogram of data divided into 1 sec bins. Red curve is a Poisson curve with rate = median count rate of data. |
 |
 |
| Quadrant-wise count rates Data is divided into 100 sec bins |
 |
|
| Module-wise count rates for Quadrant A Data is divided into 100 sec bins |
 |
 |
| Module-wise count rates for Quadrant B Data is divided into 100 sec bins |
 |
 |
| Module-wise count rates for Quadrant C Data is divided into 100 sec bins |
 |
 |
| Module-wise count rates for Quadrant D Data is divided into 100 sec bins |
 |
 |
| Parameter | Plot |
|---|---|
| CZT HV Monitor | 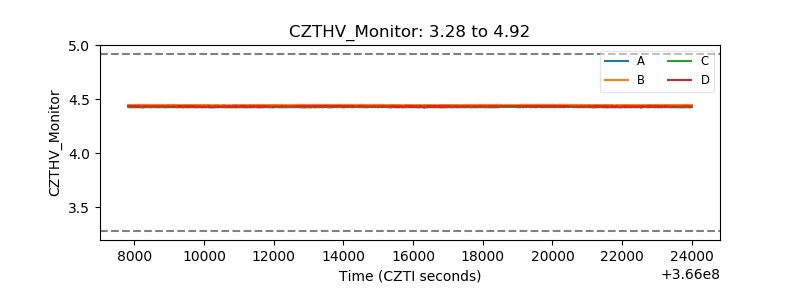 |
| D_VDD |  |
| Temperature 1 |  |
| Veto HV Monitor |  |
| Veto LLD |  |
| Alpha Counter |  |
| _CPM_Rate |  |
| CZT Counter |  |
| +2.5 Volts monitor |  |
| +5 Volts monitor |  |
| _ROLL_ROT |  |
| _Roll_DEC | 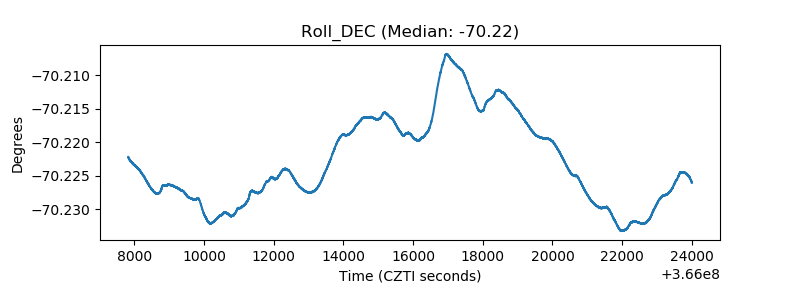 |
| _Roll_RA |  |
| Veto Counter |  |