| Param | Original file | Final file |
|---|---|---|
| Filename | modeM0/AS1T04_026T01_9000004624cztM0_level2_bc.evt | modeM0/AS1T04_026T01_9000004624cztM0_level2_quad_clean.evt |
| Size (bytes) | 1,979,481,600 | 396,959,040 |
| Size | 1.8 GB | 378.6 MB |
| Events in quadrant A | 21,363,434 | 1,959,946 |
| Events in quadrant B | 15,458,799 | 2,694,331 |
| Events in quadrant C | 6,934,452 | 2,651,281 |
| Events in quadrant D | 14,047,673 | 2,553,378 |
| Mode SS | |||
|---|---|---|---|
| Quadrant | BADHDUFLAG | Total packets | Discarded packets |
| A | 0 | 638 | 0 |
| B | 0 | 638 | 0 |
| C | 0 | 638 | 0 |
| D | 0 | 638 | 0 |
| Mode M0 | |||
|---|---|---|---|
| Quadrant | BADHDUFLAG | Total packets | Discarded packets |
| A | 0 | 149464 | 0 |
| B | 0 | 97395 | 0 |
| C | 0 | 67354 | 0 |
| D | 0 | 89587 | 0 |
| Mode M9 | |||
|---|---|---|---|
| Quadrant | BADHDUFLAG | Total packets | Discarded packets |
| A | 0 | 33 | 0 |
| B | 0 | 33 | 0 |
| C | 0 | 33 | 0 |
| D | 0 | 33 | 0 |
| Quadrant | Total seconds | Saturated seconds | Saturation percentage |
|---|---|---|---|
| A | 31427 | 14416 | 45.871384% |
| B | 31427 | 1066 | 3.391988% |
| C | 31427 | 950 | 3.022878% |
| D | 31427 | 746 | 2.373755% |
Noise dominated data is calculated using 1-second bins in cleaned event files. If a bin has >2000 counts, and if more than 50% of those come from <1% of pixels, then it is considered to be noise-dominated and hence unusable.
| Quadrant | # 1 sec bins | Bins with >0 counts | Bins with >2000 counts | High rate bins dominated by noise | Noise dominated (total time) | Noise dominated (detector-on time) | Marked lightcurve |
|---|---|---|---|---|---|---|---|
| A | 34752 | 31427 | 188 | 188 | 0.54% | 0.60% | 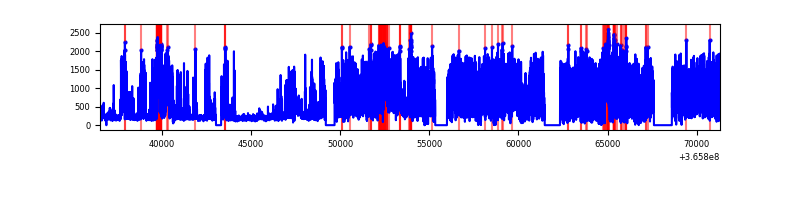 |
| B | 34752 | 31429 | 7 | 7 | 0.02% | 0.02% |  |
| C | 34752 | 31427 | 7 | 7 | 0.02% | 0.02% |  |
| D | 34752 | 31428 | 28 | 28 | 0.08% | 0.09% |  |
Top three noisy pixels from each quadrant. If the there are fewer than three noisy pixels in the level2.evt file, extra rows are filled as -1
| Pixel properties | Quadrant properties | ||||||
|---|---|---|---|---|---|---|---|
| Quadrant | DetID | PixID | Counts | Sigma | Mean | Median | Sigma |
| A | 0 | 13 | 16118310 | 61759.63 | 1197 | 1173 | 261.0 |
| A | 15 | 174 | 581627 | 2224.26 | 1197 | 1173 | 261.0 |
| A | 13 | 254 | 40175 | 149.45 | 1197 | 1173 | 261.0 |
| B | 6 | 159 | 7982901 | 25440.77 | 1624 | 1580 | 313.7 |
| B | 10 | 245 | 1009931 | 3214.16 | 1624 | 1580 | 313.7 |
| B | 0 | 190 | 175258 | 553.61 | 1624 | 1580 | 313.7 |
| C | 0 | 10 | 617903 | 1608.69 | 1574 | 1561 | 383.1 |
| C | 10 | 22 | 89780 | 230.26 | 1574 | 1561 | 383.1 |
| C | 2 | 114 | 58681 | 149.09 | 1574 | 1561 | 383.1 |
| D | 8 | 195 | 6834894 | 18566.62 | 1591 | 1534 | 368.0 |
| D | 11 | 176 | 636572 | 1725.43 | 1591 | 1534 | 368.0 |
| D | 2 | 250 | 197176 | 531.57 | 1591 | 1534 | 368.0 |
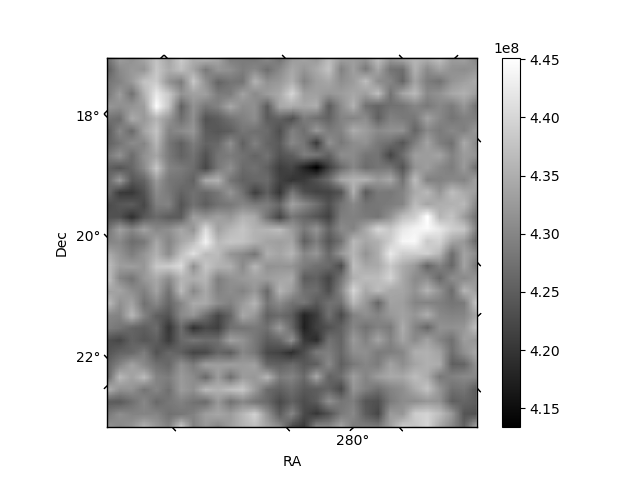
Histogram calculated using DETX and DETY for each event in the final _common_clean file
| Quadrant A |  |
 |
Quadrant B |
|---|---|---|---|
| Quadrant D |  |
 |
Quadrant C |
| Plot type | Count rate plots | Images |
|---|---|---|
| Comparison with Poisson distribution Blue bars denote a histogram of data divided into 1 sec bins. Red curve is a Poisson curve with rate = median count rate of data. |
 |
 |
| Quadrant-wise count rates Data is divided into 100 sec bins |
 |
|
| Module-wise count rates for Quadrant A Data is divided into 100 sec bins |
 |
 |
| Module-wise count rates for Quadrant B Data is divided into 100 sec bins |
 |
 |
| Module-wise count rates for Quadrant C Data is divided into 100 sec bins |
 |
 |
| Module-wise count rates for Quadrant D Data is divided into 100 sec bins |
 |
 |
| Parameter | Plot |
|---|---|
| CZT HV Monitor | 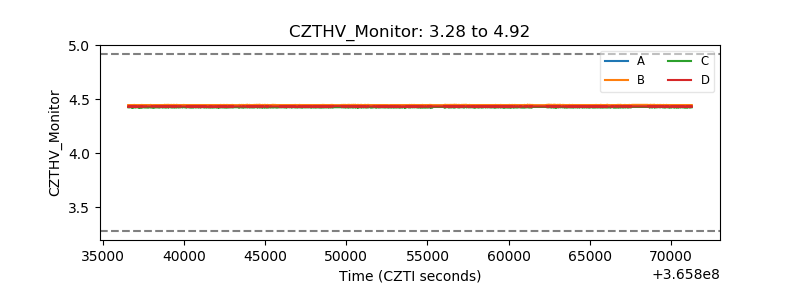 |
| D_VDD |  |
| Temperature 1 |  |
| Veto HV Monitor |  |
| Veto LLD |  |
| Alpha Counter |  |
| _CPM_Rate | 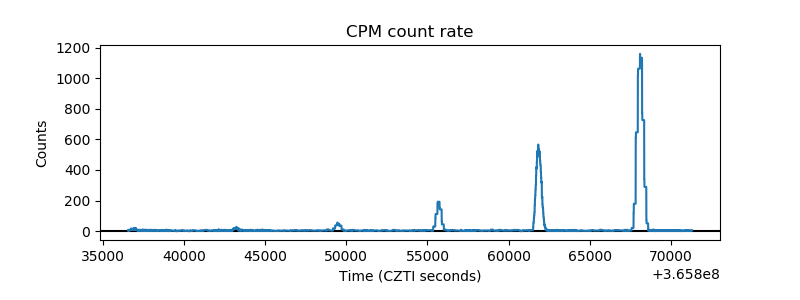 |
| CZT Counter |  |
| +2.5 Volts monitor |  |
| +5 Volts monitor |  |
| _ROLL_ROT |  |
| _Roll_DEC |  |
| _Roll_RA | 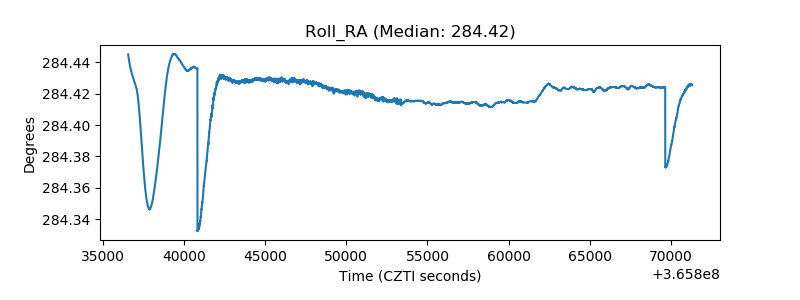 |
| Veto Counter |  |