| Param | Original file | Final file |
|---|---|---|
| Filename | modeM0/AS1A10_056T01_9000004626cztM0_level2_bc.evt | modeM0/AS1A10_056T01_9000004626cztM0_level2_quad_clean.evt |
| Size (bytes) | 4,314,559,680 | 1,310,673,600 |
| Size | 4.0 GB | 1.2 GB |
| Events in quadrant A | 21,561,065 | 8,498,299 |
| Events in quadrant B | 44,488,304 | 8,734,230 |
| Events in quadrant C | 28,947,475 | 8,378,789 |
| Events in quadrant D | 29,876,117 | 8,240,744 |
| Mode M0 | |||
|---|---|---|---|
| Quadrant | BADHDUFLAG | Total packets | Discarded packets |
| A | 0 | 194546 | 0 |
| B | 0 | 266458 | 0 |
| C | 0 | 221407 | 0 |
| D | 0 | 210365 | 0 |
| Mode M9 | |||
|---|---|---|---|
| Quadrant | BADHDUFLAG | Total packets | Discarded packets |
| A | 0 | 176 | 0 |
| B | 0 | 176 | 0 |
| C | 0 | 176 | 0 |
| D | 0 | 176 | 0 |
| Mode SS | |||
|---|---|---|---|
| Quadrant | BADHDUFLAG | Total packets | Discarded packets |
| A | 0 | 1736 | 0 |
| B | 0 | 1736 | 0 |
| C | 0 | 1736 | 0 |
| D | 0 | 1736 | 0 |
| Quadrant | Total seconds | Saturated seconds | Saturation percentage |
|---|---|---|---|
| A | 85340 | 3017 | 3.535271% |
| B | 85341 | 2261 | 2.649371% |
| C | 85341 | 4298 | 5.036266% |
| D | 85341 | 926 | 1.085059% |
Noise dominated data is calculated using 1-second bins in cleaned event files. If a bin has >2000 counts, and if more than 50% of those come from <1% of pixels, then it is considered to be noise-dominated and hence unusable.
| Quadrant | # 1 sec bins | Bins with >0 counts | Bins with >2000 counts | High rate bins dominated by noise | Noise dominated (total time) | Noise dominated (detector-on time) | Marked lightcurve |
|---|---|---|---|---|---|---|---|
| A | 123150 | 85343 | 18 | 18 | 0.01% | 0.02% |  |
| B | 123149 | 85347 | 29 | 29 | 0.02% | 0.03% |  |
| C | 123149 | 85343 | 37 | 37 | 0.03% | 0.04% |  |
| D | 123149 | 85343 | 16 | 16 | 0.01% | 0.02% |  |
Top three noisy pixels from each quadrant. If the there are fewer than three noisy pixels in the level2.evt file, extra rows are filled as -1
| Pixel properties | Quadrant properties | ||||||
|---|---|---|---|---|---|---|---|
| Quadrant | DetID | PixID | Counts | Sigma | Mean | Median | Sigma |
| A | 0 | 13 | 2767977 | 2723.69 | 4797 | 4743 | 1014.5 |
| A | 13 | 254 | 146560 | 139.79 | 4797 | 4743 | 1014.5 |
| A | 12 | 96 | 118069 | 111.7 | 4797 | 4743 | 1014.5 |
| B | 6 | 159 | 22950472 | 24875.05 | 4939 | 4842 | 922.4 |
| B | 10 | 245 | 857214 | 924.04 | 4939 | 4842 | 922.4 |
| B | 4 | 80 | 485126 | 520.67 | 4939 | 4842 | 922.4 |
| C | 3 | 233 | 5297717 | 4779.12 | 4679 | 4690 | 1107.5 |
| C | 0 | 10 | 3298805 | 2974.29 | 4679 | 4690 | 1107.5 |
| C | 10 | 22 | 1841556 | 1658.52 | 4679 | 4690 | 1107.5 |
| D | 8 | 195 | 10348060 | 9674.65 | 4813 | 4685 | 1069.1 |
| D | 2 | 234 | 363424 | 335.55 | 4813 | 4685 | 1069.1 |
| D | 2 | 250 | 309816 | 285.4 | 4813 | 4685 | 1069.1 |
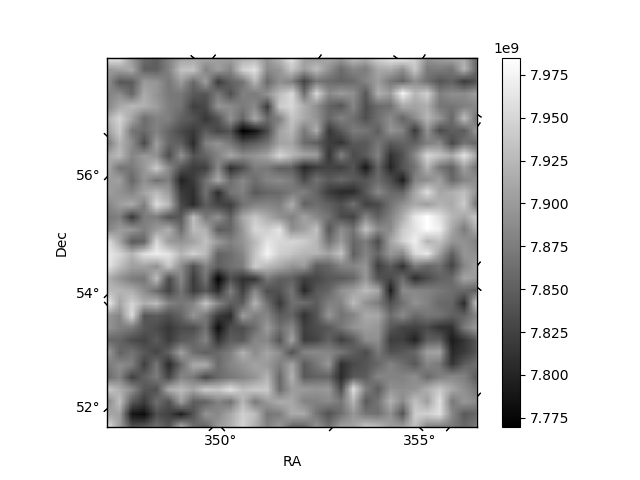
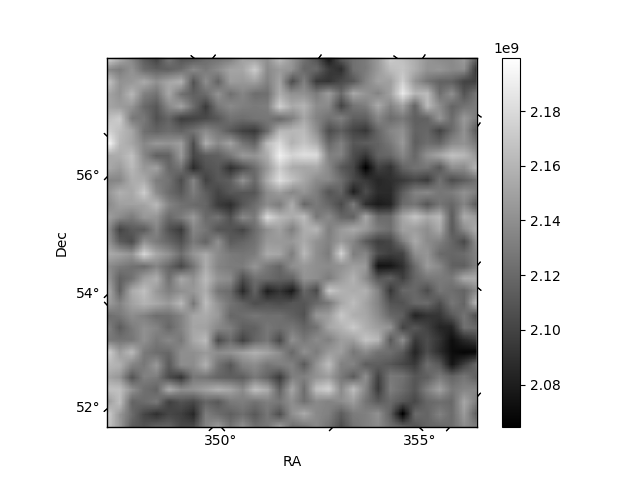
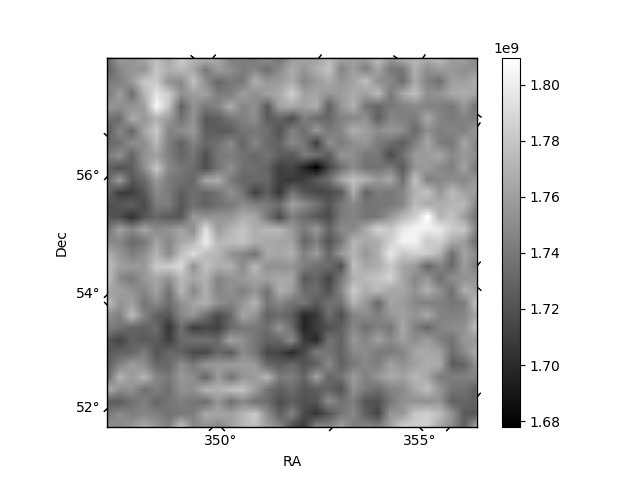
Histogram calculated using DETX and DETY for each event in the final _common_clean file
| Quadrant A |  |
 |
Quadrant B |
|---|---|---|---|
| Quadrant D |  |
 |
Quadrant C |
| Plot type | Count rate plots | Images |
|---|---|---|
| Comparison with Poisson distribution Blue bars denote a histogram of data divided into 1 sec bins. Red curve is a Poisson curve with rate = median count rate of data. |
 |
 |
| Quadrant-wise count rates Data is divided into 100 sec bins |
 |
|
| Module-wise count rates for Quadrant A Data is divided into 100 sec bins |
 |
 |
| Module-wise count rates for Quadrant B Data is divided into 100 sec bins |
 |
 |
| Module-wise count rates for Quadrant C Data is divided into 100 sec bins |
 |
 |
| Module-wise count rates for Quadrant D Data is divided into 100 sec bins |
 |
 |
| Parameter | Plot |
|---|---|
| CZT HV Monitor |  |
| D_VDD |  |
| Temperature 1 | 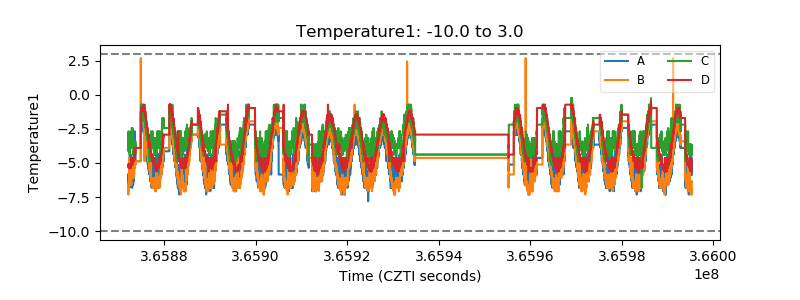 |
| Veto HV Monitor | 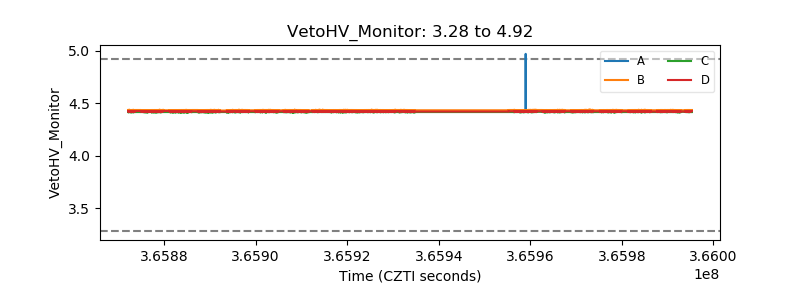 |
| Veto LLD |  |
| Alpha Counter | 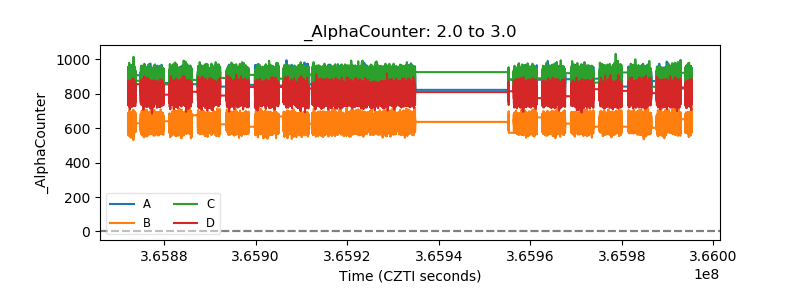 |
| _CPM_Rate | 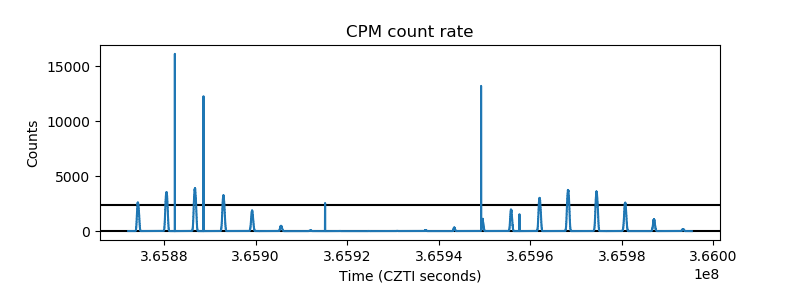 |
| CZT Counter |  |
| +2.5 Volts monitor | 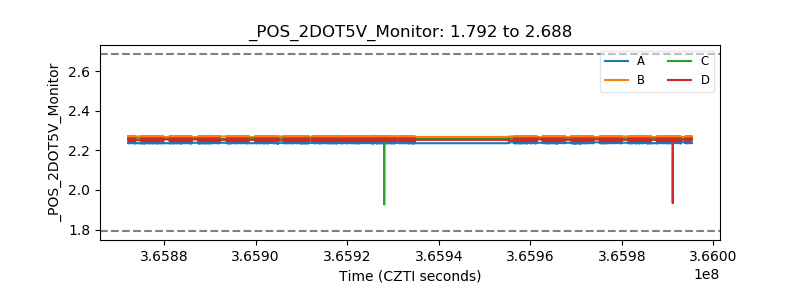 |
| +5 Volts monitor | 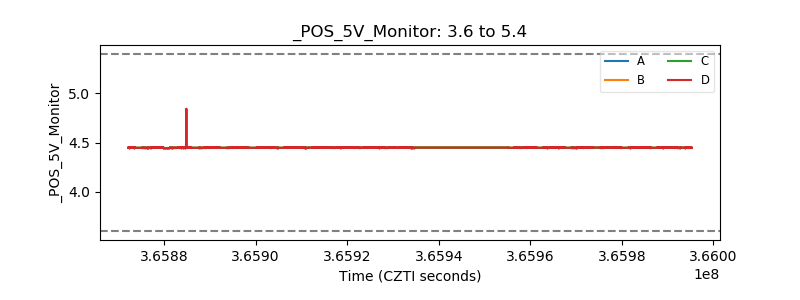 |
| _ROLL_ROT | 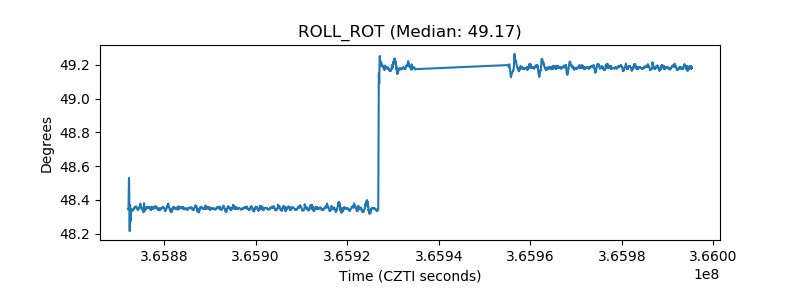 |
| _Roll_DEC |  |
| _Roll_RA | 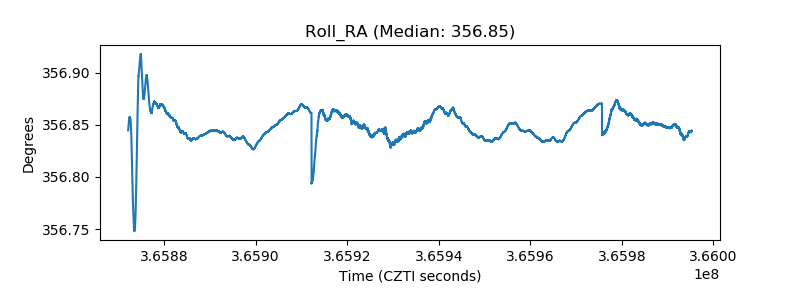 |
| Veto Counter |  |