| Param | Original file | Final file |
|---|---|---|
| Filename | modeM0/AS1A10_056T01_9000004598cztM0_level2_bc.evt | modeM0/AS1A10_056T01_9000004598cztM0_level2_quad_clean.evt |
| Size (bytes) | 9,923,011,200 | 3,043,281,600 |
| Size | 9.2 GB | 2.8 GB |
| Events in quadrant A | 48,194,672 | 19,729,857 |
| Events in quadrant B | 107,359,762 | 19,963,946 |
| Events in quadrant C | 53,202,760 | 19,151,978 |
| Events in quadrant D | 77,294,873 | 18,741,240 |
| Mode M0 | |||
|---|---|---|---|
| Quadrant | BADHDUFLAG | Total packets | Discarded packets |
| A | 0 | 456803 | 0 |
| B | 0 | 659650 | 0 |
| C | 0 | 476502 | 0 |
| D | 0 | 537229 | 0 |
| Mode M9 | |||
|---|---|---|---|
| Quadrant | BADHDUFLAG | Total packets | Discarded packets |
| A | 0 | 363 | 0 |
| B | 0 | 363 | 0 |
| C | 0 | 364 | 0 |
| D | 0 | 364 | 0 |
| Mode SS | |||
|---|---|---|---|
| Quadrant | BADHDUFLAG | Total packets | Discarded packets |
| A | 0 | 4348 | 0 |
| B | 0 | 4350 | 0 |
| C | 0 | 4348 | 0 |
| D | 0 | 4348 | 0 |
| Quadrant | Total seconds | Saturated seconds | Saturation percentage |
|---|---|---|---|
| A | 213103 | 4177 | 1.960085% |
| B | 213091 | 5917 | 2.776748% |
| C | 213094 | 6283 | 2.948464% |
| D | 213107 | 4492 | 2.107861% |
Noise dominated data is calculated using 1-second bins in cleaned event files. If a bin has >2000 counts, and if more than 50% of those come from <1% of pixels, then it is considered to be noise-dominated and hence unusable.
| Quadrant | # 1 sec bins | Bins with >0 counts | Bins with >2000 counts | High rate bins dominated by noise | Noise dominated (total time) | Noise dominated (detector-on time) | Marked lightcurve |
|---|---|---|---|---|---|---|---|
| A | 259686 | 213119 | 82 | 82 | 0.03% | 0.04% |  |
| B | 259686 | 213107 | 37 | 37 | 0.01% | 0.02% |  |
| C | 259686 | 213111 | 214 | 214 | 0.08% | 0.10% |  |
| D | 259686 | 213115 | 152 | 152 | 0.06% | 0.07% |  |
Top three noisy pixels from each quadrant. If the there are fewer than three noisy pixels in the level2.evt file, extra rows are filled as -1
| Pixel properties | Quadrant properties | ||||||
|---|---|---|---|---|---|---|---|
| Quadrant | DetID | PixID | Counts | Sigma | Mean | Median | Sigma |
| A | 0 | 13 | 3859778 | 1560.56 | 11438 | 11279 | 2466.1 |
| A | 13 | 254 | 360770 | 141.72 | 11438 | 11279 | 2466.1 |
| A | 5 | 168 | 118160 | 43.34 | 11438 | 11279 | 2466.1 |
| B | 6 | 159 | 56064858 | 25579.98 | 11591 | 11338 | 2191.3 |
| B | 4 | 80 | 3845812 | 1749.86 | 11591 | 11338 | 2191.3 |
| B | 0 | 190 | 963918 | 434.71 | 11591 | 11338 | 2191.3 |
| C | 3 | 233 | 4649819 | 1780.55 | 11028 | 11020 | 2605.3 |
| C | 10 | 22 | 3573257 | 1367.32 | 11028 | 11020 | 2605.3 |
| C | 0 | 10 | 1126876 | 428.31 | 11028 | 11020 | 2605.3 |
| D | 8 | 195 | 25916830 | 10093.76 | 11229 | 10889 | 2566.5 |
| D | 12 | 218 | 2870135 | 1114.05 | 11229 | 10889 | 2566.5 |
| D | 2 | 250 | 1740790 | 674.02 | 11229 | 10889 | 2566.5 |
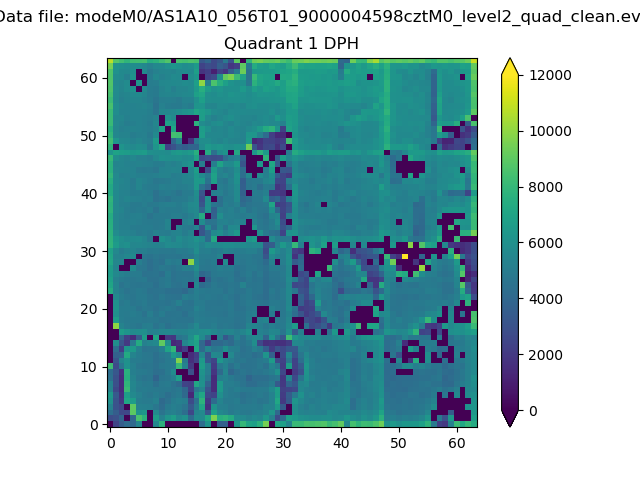
Histogram calculated using DETX and DETY for each event in the final _common_clean file
| Quadrant A |  |
 |
Quadrant B |
|---|---|---|---|
| Quadrant D | 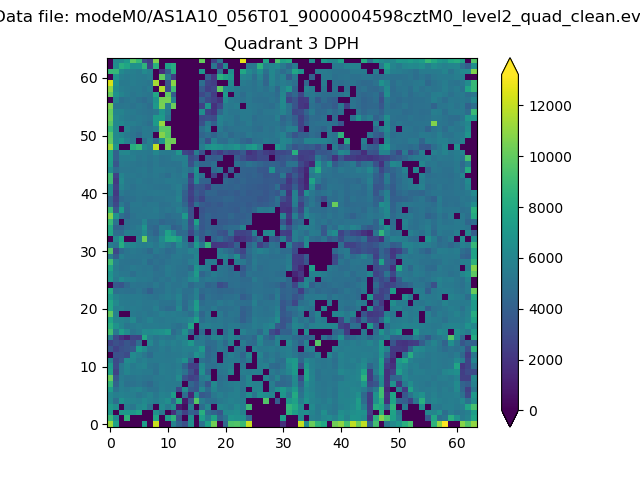 |
 |
Quadrant C |
| Plot type | Count rate plots | Images |
|---|---|---|
| Comparison with Poisson distribution Blue bars denote a histogram of data divided into 1 sec bins. Red curve is a Poisson curve with rate = median count rate of data. |
 |
 |
| Quadrant-wise count rates Data is divided into 100 sec bins |
 |
|
| Module-wise count rates for Quadrant A Data is divided into 100 sec bins |
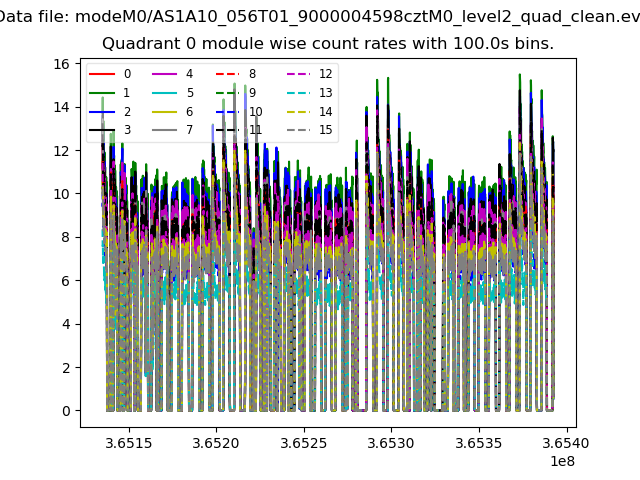 |
 |
| Module-wise count rates for Quadrant B Data is divided into 100 sec bins |
 |
 |
| Module-wise count rates for Quadrant C Data is divided into 100 sec bins |
 |
 |
| Module-wise count rates for Quadrant D Data is divided into 100 sec bins |
 |
 |
| Parameter | Plot |
|---|---|
| CZT HV Monitor |  |
| D_VDD |  |
| Temperature 1 | 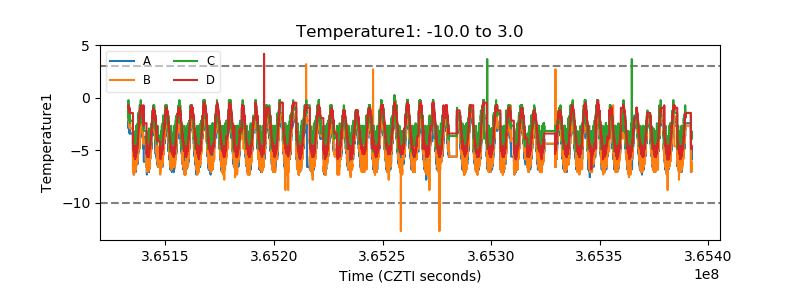 |
| Veto HV Monitor |  |
| Veto LLD | 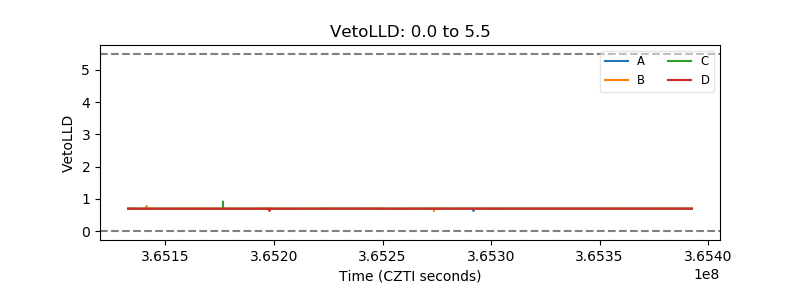 |
| Alpha Counter |  |
| _CPM_Rate | 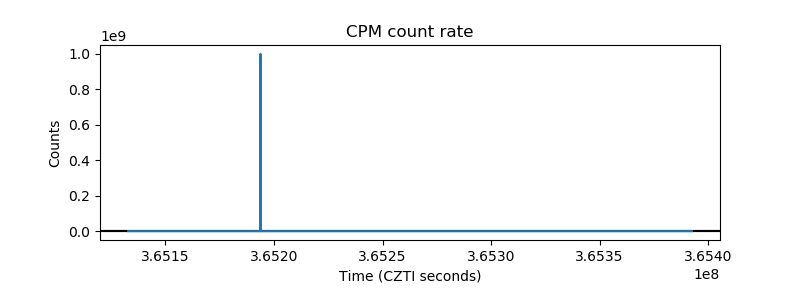 |
| CZT Counter |  |
| +2.5 Volts monitor | 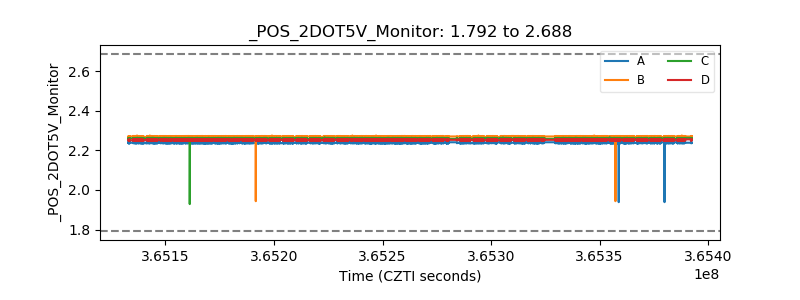 |
| +5 Volts monitor |  |
| _ROLL_ROT | 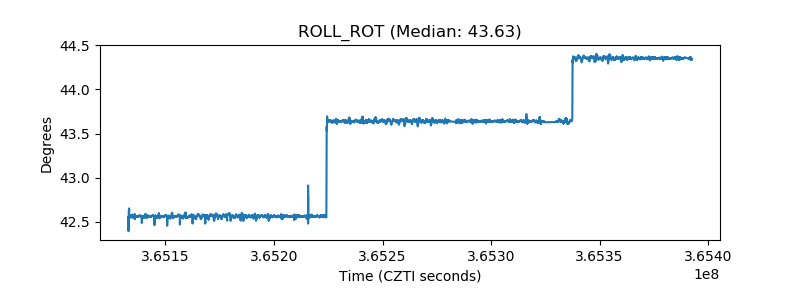 |
| _Roll_DEC |  |
| _Roll_RA |  |
| Veto Counter |  |