| Param | Original file | Final file |
|---|---|---|
| Filename | modeM0/AS1A10_053T21_9000004592cztM0_level2_bc.evt | modeM0/AS1A10_053T21_9000004592cztM0_level2_quad_clean.evt |
| Size (bytes) | 319,956,480 | 79,453,440 |
| Size | 305.1 MB | 75.8 MB |
| Events in quadrant A | 1,470,166 | 501,979 |
| Events in quadrant B | 3,121,491 | 499,095 |
| Events in quadrant C | 1,507,116 | 488,508 |
| Events in quadrant D | 3,156,921 | 478,042 |
| Mode SS | |||
|---|---|---|---|
| Quadrant | BADHDUFLAG | Total packets | Discarded packets |
| A | 0 | 130 | 0 |
| B | 0 | 130 | 0 |
| C | 0 | 130 | 0 |
| D | 0 | 130 | 0 |
| Mode M9 | |||
|---|---|---|---|
| Quadrant | BADHDUFLAG | Total packets | Discarded packets |
| A | 0 | 10 | 0 |
| B | 0 | 10 | 0 |
| C | 0 | 10 | 0 |
| D | 0 | 10 | 0 |
| Mode M0 | |||
|---|---|---|---|
| Quadrant | BADHDUFLAG | Total packets | Discarded packets |
| A | 0 | 13940 | 0 |
| B | 0 | 19506 | 0 |
| C | 0 | 13923 | 0 |
| D | 0 | 19265 | 0 |
| Quadrant | Total seconds | Saturated seconds | Saturation percentage |
|---|---|---|---|
| A | 6283 | 217 | 3.453764% |
| B | 6283 | 246 | 3.915327% |
| C | 6283 | 219 | 3.485596% |
| D | 6283 | 277 | 4.408722% |
Noise dominated data is calculated using 1-second bins in cleaned event files. If a bin has >2000 counts, and if more than 50% of those come from <1% of pixels, then it is considered to be noise-dominated and hence unusable.
| Quadrant | # 1 sec bins | Bins with >0 counts | Bins with >2000 counts | High rate bins dominated by noise | Noise dominated (total time) | Noise dominated (detector-on time) | Marked lightcurve |
|---|---|---|---|---|---|---|---|
| A | 7183 | 6281 | 11 | 11 | 0.15% | 0.18% |  |
| B | 7183 | 6282 | 0 | 0 | 0.00% | 0.00% |  |
| C | 7183 | 6280 | 2 | 2 | 0.03% | 0.03% | 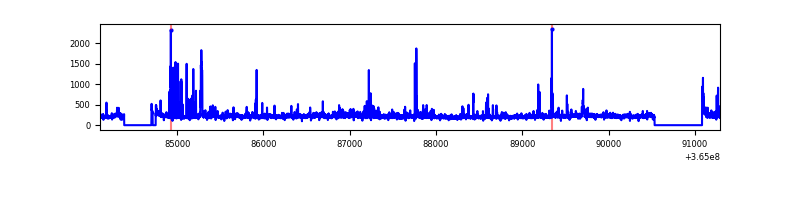 |
| D | 7183 | 6280 | 14 | 14 | 0.19% | 0.22% |  |
Top three noisy pixels from each quadrant. If the there are fewer than three noisy pixels in the level2.evt file, extra rows are filled as -1
| Pixel properties | Quadrant properties | ||||||
|---|---|---|---|---|---|---|---|
| Quadrant | DetID | PixID | Counts | Sigma | Mean | Median | Sigma |
| A | 0 | 13 | 238278 | 3313.87 | 318 | 310 | 71.8 |
| A | 13 | 254 | 11544 | 156.43 | 318 | 310 | 71.8 |
| A | 12 | 194 | 1949 | 22.82 | 318 | 310 | 71.8 |
| B | 6 | 159 | 1659643 | 25882.27 | 317 | 308 | 64.1 |
| B | 4 | 80 | 151560 | 2359.23 | 317 | 308 | 64.1 |
| B | 0 | 230 | 20879 | 320.87 | 317 | 308 | 64.1 |
| C | 3 | 233 | 135132 | 1790.18 | 309 | 305 | 75.3 |
| C | 0 | 10 | 92746 | 1227.39 | 309 | 305 | 75.3 |
| C | 10 | 22 | 54565 | 720.44 | 309 | 305 | 75.3 |
| D | 8 | 195 | 1471762 | 19895.76 | 313 | 301 | 74.0 |
| D | 12 | 79 | 187571 | 2532.09 | 313 | 301 | 74.0 |
| D | 13 | 249 | 133859 | 1805.85 | 313 | 301 | 74.0 |
Histogram calculated using DETX and DETY for each event in the final _common_clean file
| Quadrant A |  |
 |
Quadrant B |
|---|---|---|---|
| Quadrant D |  |
 |
Quadrant C |
| Plot type | Count rate plots | Images |
|---|---|---|
| Comparison with Poisson distribution Blue bars denote a histogram of data divided into 1 sec bins. Red curve is a Poisson curve with rate = median count rate of data. |
 |
 |
| Quadrant-wise count rates Data is divided into 100 sec bins |
 |
|
| Module-wise count rates for Quadrant A Data is divided into 100 sec bins |
 |
 |
| Module-wise count rates for Quadrant B Data is divided into 100 sec bins |
 |
 |
| Module-wise count rates for Quadrant C Data is divided into 100 sec bins |
 |
 |
| Module-wise count rates for Quadrant D Data is divided into 100 sec bins |
 |
 |
| Parameter | Plot |
|---|---|
| CZT HV Monitor |  |
| D_VDD |  |
| Temperature 1 |  |
| Veto HV Monitor |  |
| Veto LLD |  |
| Alpha Counter |  |
| _CPM_Rate |  |
| CZT Counter |  |
| +2.5 Volts monitor |  |
| +5 Volts monitor |  |
| _ROLL_ROT | 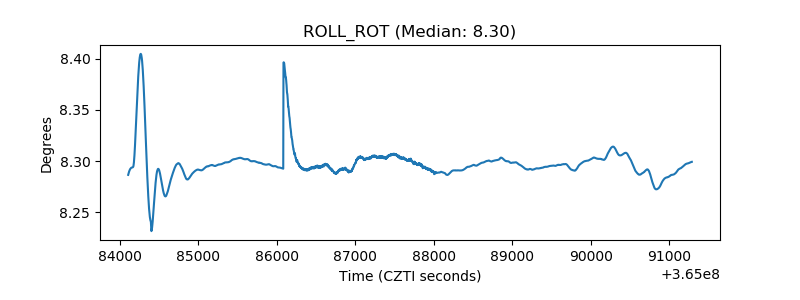 |
| _Roll_DEC |  |
| _Roll_RA |  |
| Veto Counter |  |