| Param | Original file | Final file |
|---|---|---|
| Filename | modeM0/AS1T04_030T01_9000004588cztM0_level2_bc.evt | modeM0/AS1T04_030T01_9000004588cztM0_level2_quad_clean.evt |
| Size (bytes) | 2,079,106,560 | 427,176,000 |
| Size | 1.9 GB | 407.4 MB |
| Events in quadrant A | 13,187,824 | 2,563,257 |
| Events in quadrant B | 17,466,345 | 2,786,744 |
| Events in quadrant C | 16,909,449 | 2,564,413 |
| Events in quadrant D | 13,063,621 | 2,661,763 |
| Mode M0 | |||
|---|---|---|---|
| Quadrant | BADHDUFLAG | Total packets | Discarded packets |
| A | 0 | 103072 | 0 |
| B | 0 | 105904 | 0 |
| C | 0 | 109769 | 0 |
| D | 0 | 89650 | 0 |
| Mode SS | |||
|---|---|---|---|
| Quadrant | BADHDUFLAG | Total packets | Discarded packets |
| A | 0 | 698 | 0 |
| B | 0 | 706 | 0 |
| C | 0 | 703 | 0 |
| D | 0 | 702 | 0 |
| Mode M9 | |||
|---|---|---|---|
| Quadrant | BADHDUFLAG | Total packets | Discarded packets |
| A | 0 | 52 | 0 |
| B | 0 | 52 | 0 |
| C | 0 | 52 | 0 |
| D | 0 | 52 | 0 |
| Quadrant | Total seconds | Saturated seconds | Saturation percentage |
|---|---|---|---|
| A | 34564 | 5140 | 14.870964% |
| B | 34120 | 1133 | 3.320633% |
| C | 34283 | 4991 | 14.558236% |
| D | 34318 | 1094 | 3.187831% |
Noise dominated data is calculated using 1-second bins in cleaned event files. If a bin has >2000 counts, and if more than 50% of those come from <1% of pixels, then it is considered to be noise-dominated and hence unusable.
| Quadrant | # 1 sec bins | Bins with >0 counts | Bins with >2000 counts | High rate bins dominated by noise | Noise dominated (total time) | Noise dominated (detector-on time) | Marked lightcurve |
|---|---|---|---|---|---|---|---|
| A | 51536 | 35301 | 141 | 141 | 0.27% | 0.40% |  |
| B | 51537 | 34786 | 46 | 46 | 0.09% | 0.13% |  |
| C | 51537 | 35016 | 249 | 249 | 0.48% | 0.71% |  |
| D | 51537 | 35040 | 96 | 96 | 0.19% | 0.27% |  |
Top three noisy pixels from each quadrant. If the there are fewer than three noisy pixels in the level2.evt file, extra rows are filled as -1
| Pixel properties | Quadrant properties | ||||||
|---|---|---|---|---|---|---|---|
| Quadrant | DetID | PixID | Counts | Sigma | Mean | Median | Sigma |
| A | 0 | 13 | 6255642 | 16916.71 | 1708 | 1679 | 369.7 |
| A | 15 | 174 | 325395 | 875.64 | 1708 | 1679 | 369.7 |
| A | 13 | 254 | 55179 | 144.72 | 1708 | 1679 | 369.7 |
| B | 6 | 159 | 9166983 | 26267.94 | 1841 | 1799 | 348.9 |
| B | 5 | 172 | 486531 | 1389.27 | 1841 | 1799 | 348.9 |
| B | 4 | 80 | 164232 | 465.54 | 1841 | 1799 | 348.9 |
| C | 3 | 233 | 8837735 | 22123.34 | 1691 | 1689 | 399.4 |
| C | 10 | 22 | 1224452 | 3061.5 | 1691 | 1689 | 399.4 |
| C | 0 | 10 | 154810 | 383.38 | 1691 | 1689 | 399.4 |
| D | 8 | 195 | 3394746 | 8187.96 | 1803 | 1745 | 414.4 |
| D | 12 | 218 | 797751 | 1920.91 | 1803 | 1745 | 414.4 |
| D | 2 | 250 | 580030 | 1395.51 | 1803 | 1745 | 414.4 |
Histogram calculated using DETX and DETY for each event in the final _common_clean file
| Quadrant A |  |
 |
Quadrant B |
|---|---|---|---|
| Quadrant D |  |
 |
Quadrant C |
| Plot type | Count rate plots | Images |
|---|---|---|
| Comparison with Poisson distribution Blue bars denote a histogram of data divided into 1 sec bins. Red curve is a Poisson curve with rate = median count rate of data. |
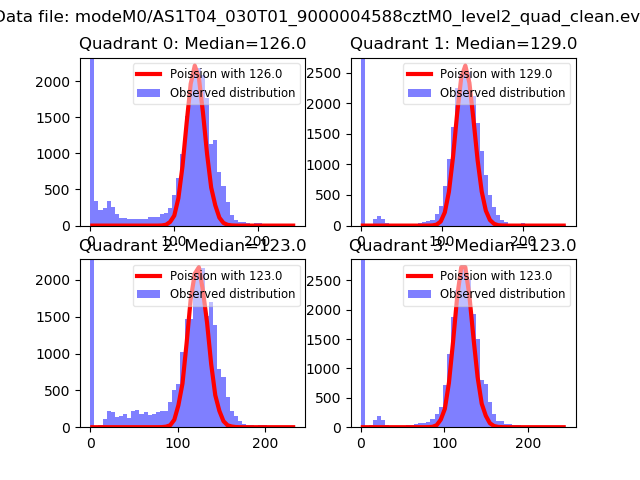 |
 |
| Quadrant-wise count rates Data is divided into 100 sec bins |
 |
|
| Module-wise count rates for Quadrant A Data is divided into 100 sec bins |
 |
 |
| Module-wise count rates for Quadrant B Data is divided into 100 sec bins |
 |
 |
| Module-wise count rates for Quadrant C Data is divided into 100 sec bins |
 |
 |
| Module-wise count rates for Quadrant D Data is divided into 100 sec bins |
 |
 |
| Parameter | Plot |
|---|---|
| CZT HV Monitor |  |
| D_VDD |  |
| Temperature 1 |  |
| Veto HV Monitor |  |
| Veto LLD |  |
| Alpha Counter |  |
| _CPM_Rate |  |
| CZT Counter |  |
| +2.5 Volts monitor |  |
| +5 Volts monitor |  |
| _ROLL_ROT | 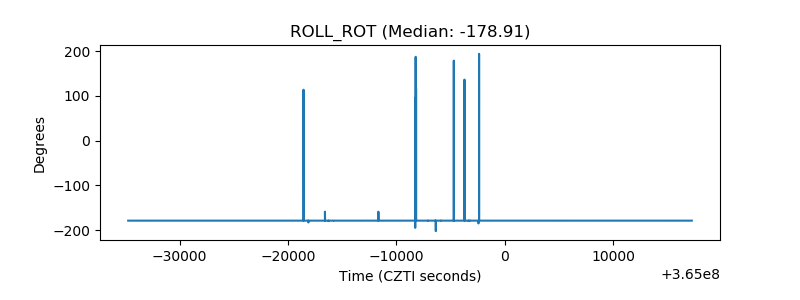 |
| _Roll_DEC | 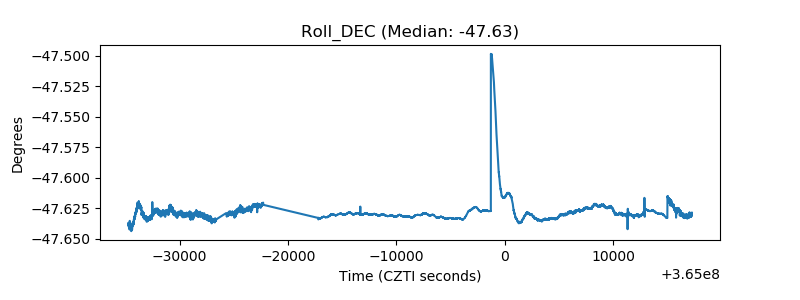 |
| _Roll_RA |  |
| Veto Counter |  |