| Param | Original file | Final file |
|---|---|---|
| Filename | modeM0/AS1A10_119T01_9000004590cztM0_level2_bc.evt | modeM0/AS1A10_119T01_9000004590cztM0_level2_quad_clean.evt |
| Size (bytes) | 2,585,125,440 | 560,459,520 |
| Size | 2.4 GB | 534.5 MB |
| Events in quadrant A | 21,030,730 | 3,312,574 |
| Events in quadrant B | 23,477,626 | 3,647,014 |
| Events in quadrant C | 11,790,523 | 3,532,023 |
| Events in quadrant D | 18,895,530 | 3,357,803 |
| Mode M9 | |||
|---|---|---|---|
| Quadrant | BADHDUFLAG | Total packets | Discarded packets |
| A | 0 | 70 | 0 |
| B | 0 | 70 | 0 |
| C | 0 | 69 | 0 |
| D | 0 | 70 | 0 |
| Mode M0 | |||
|---|---|---|---|
| Quadrant | BADHDUFLAG | Total packets | Discarded packets |
| A | 0 | 150133 | 0 |
| B | 0 | 142010 | 0 |
| C | 0 | 102893 | 0 |
| D | 0 | 122912 | 0 |
| Mode SS | |||
|---|---|---|---|
| Quadrant | BADHDUFLAG | Total packets | Discarded packets |
| A | 0 | 928 | 0 |
| B | 0 | 926 | 0 |
| C | 0 | 926 | 0 |
| D | 0 | 925 | 0 |
| Quadrant | Total seconds | Saturated seconds | Saturation percentage |
|---|---|---|---|
| A | 45478 | 8193 | 18.015304% |
| B | 45398 | 1319 | 2.905414% |
| C | 45550 | 1096 | 2.406147% |
| D | 45598 | 1748 | 3.833501% |
Noise dominated data is calculated using 1-second bins in cleaned event files. If a bin has >2000 counts, and if more than 50% of those come from <1% of pixels, then it is considered to be noise-dominated and hence unusable.
| Quadrant | # 1 sec bins | Bins with >0 counts | Bins with >2000 counts | High rate bins dominated by noise | Noise dominated (total time) | Noise dominated (detector-on time) | Marked lightcurve |
|---|---|---|---|---|---|---|---|
| A | 65041 | 45851 | 342 | 342 | 0.53% | 0.75% |  |
| B | 65041 | 45764 | 17 | 17 | 0.03% | 0.04% |  |
| C | 65041 | 45920 | 29 | 29 | 0.04% | 0.06% | 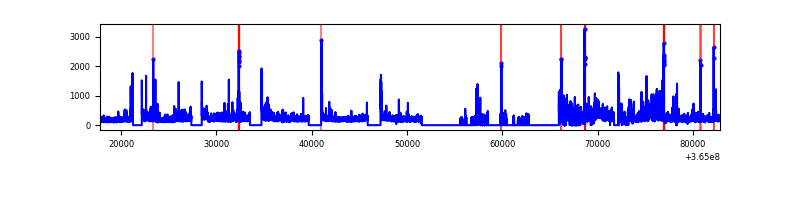 |
| D | 65041 | 45973 | 437 | 437 | 0.67% | 0.95% |  |
Top three noisy pixels from each quadrant. If the there are fewer than three noisy pixels in the level2.evt file, extra rows are filled as -1
| Pixel properties | Quadrant properties | ||||||
|---|---|---|---|---|---|---|---|
| Quadrant | DetID | PixID | Counts | Sigma | Mean | Median | Sigma |
| A | 0 | 13 | 12228098 | 25032.15 | 2266 | 2228 | 488.4 |
| A | 13 | 254 | 74838 | 148.67 | 2266 | 2228 | 488.4 |
| A | 13 | 170 | 47907 | 93.53 | 2266 | 2228 | 488.4 |
| B | 6 | 159 | 12175029 | 25602.21 | 2522 | 2465 | 475.4 |
| B | 4 | 80 | 549156 | 1149.84 | 2522 | 2465 | 475.4 |
| B | 5 | 172 | 378048 | 789.95 | 2522 | 2465 | 475.4 |
| C | 3 | 233 | 1274493 | 2237.52 | 2414 | 2410 | 568.5 |
| C | 0 | 10 | 865704 | 1518.49 | 2414 | 2410 | 568.5 |
| C | 2 | 114 | 86347 | 147.64 | 2414 | 2410 | 568.5 |
| D | 8 | 195 | 3901201 | 7139.83 | 2417 | 2340 | 546.1 |
| D | 12 | 79 | 3469536 | 6349.34 | 2417 | 2340 | 546.1 |
| D | 12 | 233 | 687265 | 1254.28 | 2417 | 2340 | 546.1 |
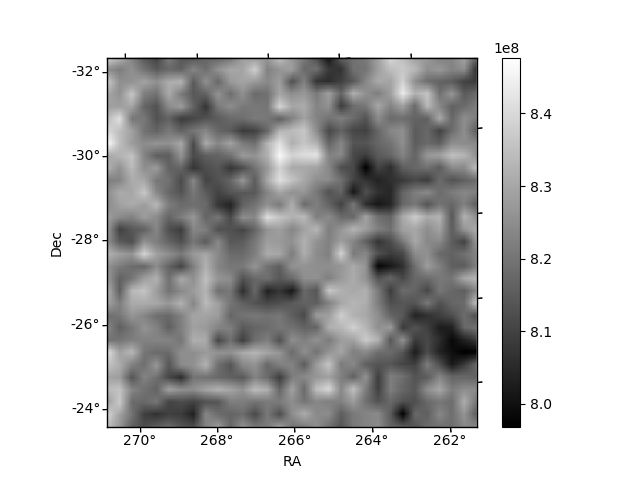
Histogram calculated using DETX and DETY for each event in the final _common_clean file
| Quadrant A | 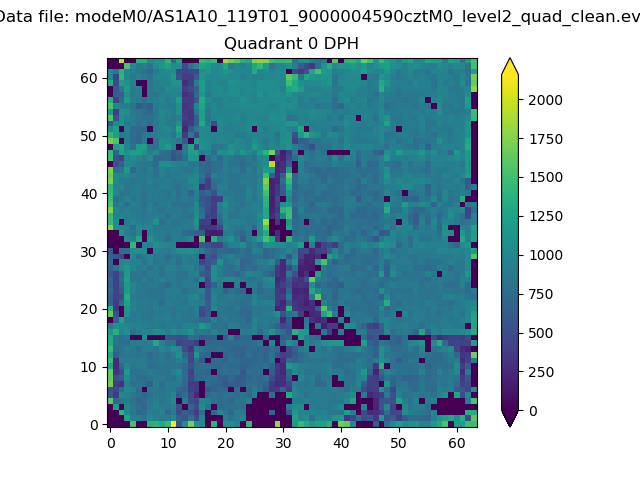 |
 |
Quadrant B |
|---|---|---|---|
| Quadrant D |  |
 |
Quadrant C |
| Plot type | Count rate plots | Images |
|---|---|---|
| Comparison with Poisson distribution Blue bars denote a histogram of data divided into 1 sec bins. Red curve is a Poisson curve with rate = median count rate of data. |
 |
 |
| Quadrant-wise count rates Data is divided into 100 sec bins |
 |
|
| Module-wise count rates for Quadrant A Data is divided into 100 sec bins |
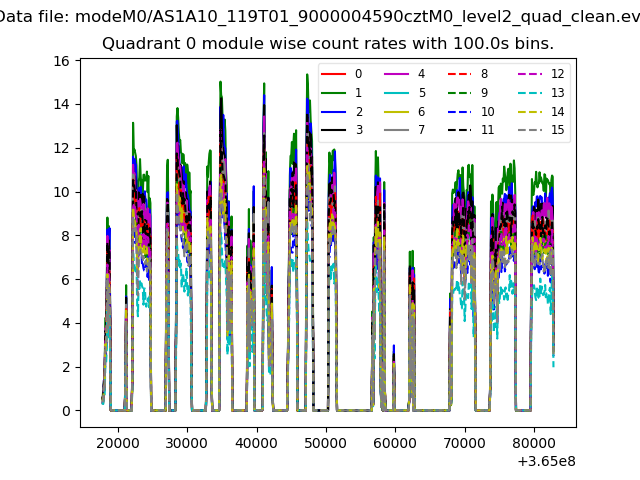 |
 |
| Module-wise count rates for Quadrant B Data is divided into 100 sec bins |
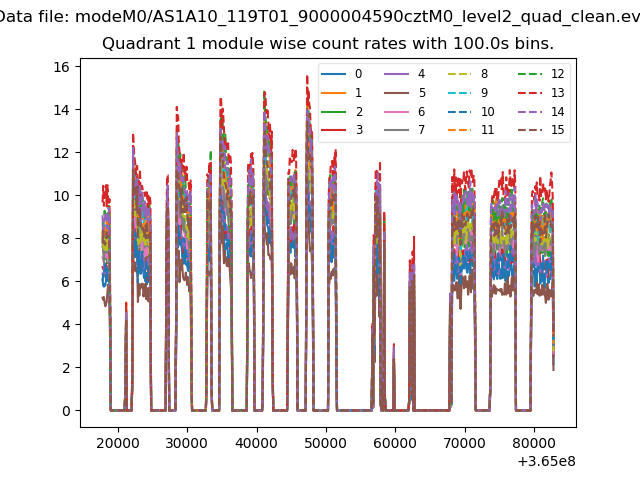 |
 |
| Module-wise count rates for Quadrant C Data is divided into 100 sec bins |
 |
 |
| Module-wise count rates for Quadrant D Data is divided into 100 sec bins |
 |
 |
| Parameter | Plot |
|---|---|
| CZT HV Monitor |  |
| D_VDD | 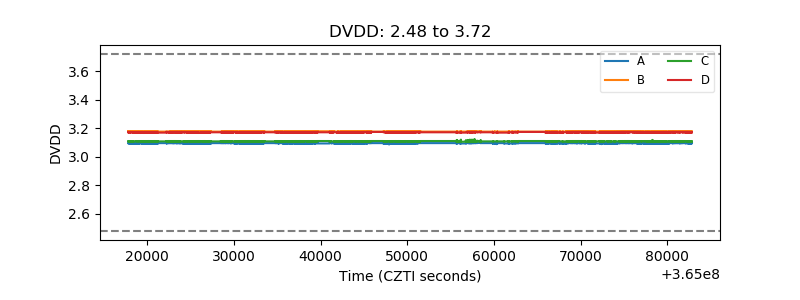 |
| Temperature 1 |  |
| Veto HV Monitor |  |
| Veto LLD | 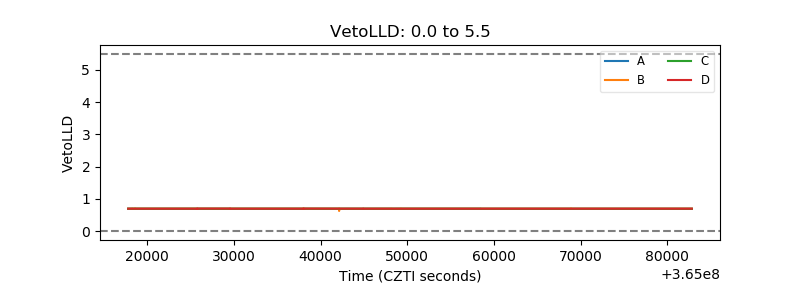 |
| Alpha Counter |  |
| _CPM_Rate |  |
| CZT Counter |  |
| +2.5 Volts monitor |  |
| +5 Volts monitor |  |
| _ROLL_ROT |  |
| _Roll_DEC |  |
| _Roll_RA |  |
| Veto Counter | 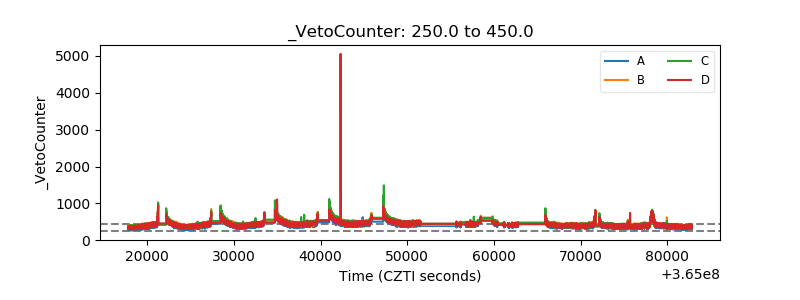 |