| Param | Original file | Final file |
|---|---|---|
| Filename | modeM0/AS1A10_048T04_9000004586cztM0_level2_bc.evt | modeM0/AS1A10_048T04_9000004586cztM0_level2_quad_clean.evt |
| Size (bytes) | 373,728,960 | 90,483,840 |
| Size | 356.4 MB | 86.3 MB |
| Events in quadrant A | 1,902,876 | 577,021 |
| Events in quadrant B | 3,870,332 | 579,159 |
| Events in quadrant C | 1,993,307 | 541,852 |
| Events in quadrant D | 3,044,850 | 530,172 |
| Mode M0 | |||
|---|---|---|---|
| Quadrant | BADHDUFLAG | Total packets | Discarded packets |
| A | 0 | 16276 | 0 |
| B | 0 | 22982 | 0 |
| C | 0 | 17091 | 0 |
| D | 0 | 19773 | 0 |
| Mode SS | |||
|---|---|---|---|
| Quadrant | BADHDUFLAG | Total packets | Discarded packets |
| A | 0 | 150 | 0 |
| B | 0 | 150 | 0 |
| C | 0 | 148 | 0 |
| D | 0 | 150 | 0 |
| Mode M9 | |||
|---|---|---|---|
| Quadrant | BADHDUFLAG | Total packets | Discarded packets |
| A | 0 | 24 | 0 |
| B | 0 | 24 | 0 |
| C | 0 | 24 | 0 |
| D | 0 | 24 | 0 |
| Quadrant | Total seconds | Saturated seconds | Saturation percentage |
|---|---|---|---|
| A | 7374 | 85 | 1.152699% |
| B | 7361 | 156 | 2.119277% |
| C | 7366 | 299 | 4.059191% |
| D | 7346 | 101 | 1.374898% |
Noise dominated data is calculated using 1-second bins in cleaned event files. If a bin has >2000 counts, and if more than 50% of those come from <1% of pixels, then it is considered to be noise-dominated and hence unusable.
| Quadrant | # 1 sec bins | Bins with >0 counts | Bins with >2000 counts | High rate bins dominated by noise | Noise dominated (total time) | Noise dominated (detector-on time) | Marked lightcurve |
|---|---|---|---|---|---|---|---|
| A | 10452 | 7409 | 1 | 1 | 0.01% | 0.01% |  |
| B | 10452 | 7401 | 0 | 0 | 0.00% | 0.00% |  |
| C | 10452 | 7402 | 4 | 4 | 0.04% | 0.05% |  |
| D | 10452 | 7388 | 5 | 5 | 0.05% | 0.07% |  |
Top three noisy pixels from each quadrant. If the there are fewer than three noisy pixels in the level2.evt file, extra rows are filled as -1
| Pixel properties | Quadrant properties | ||||||
|---|---|---|---|---|---|---|---|
| Quadrant | DetID | PixID | Counts | Sigma | Mean | Median | Sigma |
| A | 0 | 13 | 79815 | 793.01 | 473 | 465 | 100.1 |
| A | 13 | 254 | 12339 | 118.67 | 473 | 465 | 100.1 |
| A | 0 | 226 | 3018 | 25.51 | 473 | 465 | 100.1 |
| B | 6 | 159 | 1914362 | 21495.2 | 476 | 467 | 89.0 |
| B | 4 | 80 | 51542 | 573.63 | 476 | 467 | 89.0 |
| B | 0 | 230 | 21858 | 240.25 | 476 | 467 | 89.0 |
| C | 0 | 10 | 229037 | 2233.66 | 437 | 437 | 102.3 |
| C | 12 | 249 | 30596 | 294.68 | 437 | 437 | 102.3 |
| C | 14 | 225 | 26267 | 252.39 | 437 | 437 | 102.3 |
| D | 8 | 195 | 1117762 | 11229.25 | 447 | 434 | 99.5 |
| D | 2 | 250 | 101469 | 1015.41 | 447 | 434 | 99.5 |
| D | 12 | 79 | 46269 | 460.65 | 447 | 434 | 99.5 |
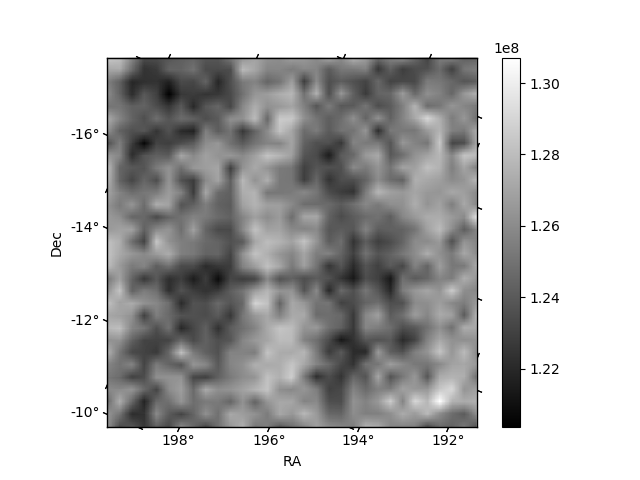
Histogram calculated using DETX and DETY for each event in the final _common_clean file
| Quadrant A |  |
 |
Quadrant B |
|---|---|---|---|
| Quadrant D |  |
 |
Quadrant C |
| Plot type | Count rate plots | Images |
|---|---|---|
| Comparison with Poisson distribution Blue bars denote a histogram of data divided into 1 sec bins. Red curve is a Poisson curve with rate = median count rate of data. |
 |
 |
| Quadrant-wise count rates Data is divided into 100 sec bins |
 |
|
| Module-wise count rates for Quadrant A Data is divided into 100 sec bins |
 |
 |
| Module-wise count rates for Quadrant B Data is divided into 100 sec bins |
 |
 |
| Module-wise count rates for Quadrant C Data is divided into 100 sec bins |
 |
 |
| Module-wise count rates for Quadrant D Data is divided into 100 sec bins |
 |
 |
| Parameter | Plot |
|---|---|
| CZT HV Monitor |  |
| D_VDD |  |
| Temperature 1 |  |
| Veto HV Monitor |  |
| Veto LLD |  |
| Alpha Counter |  |
| _CPM_Rate |  |
| CZT Counter |  |
| +2.5 Volts monitor |  |
| +5 Volts monitor |  |
| _ROLL_ROT |  |
| _Roll_DEC |  |
| _Roll_RA | 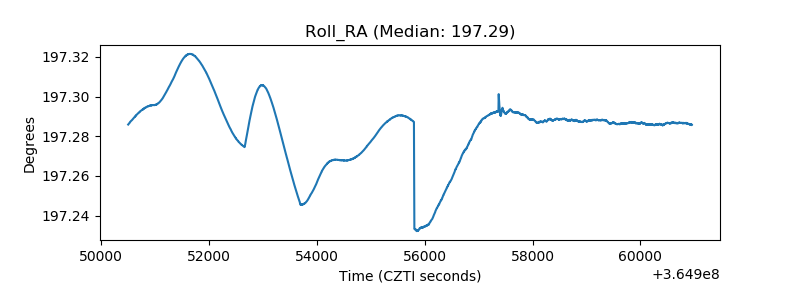 |
| Veto Counter | 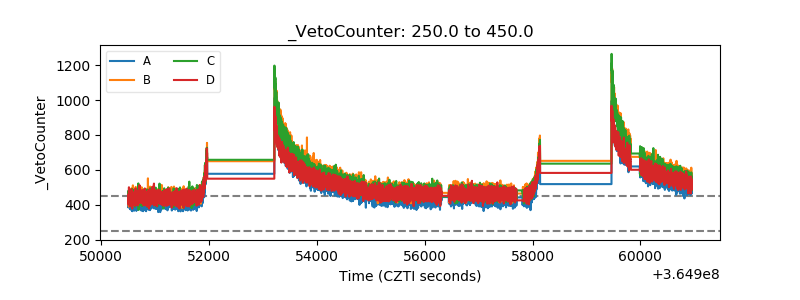 |