| Param | Original file | Final file |
|---|---|---|
| Filename | modeM0/AS1T04_028T01_9000004584cztM0_level2_bc.evt | modeM0/AS1T04_028T01_9000004584cztM0_level2_quad_clean.evt |
| Size (bytes) | 4,336,882,560 | 1,033,663,680 |
| Size | 4.0 GB | 985.8 MB |
| Events in quadrant A | 19,868,589 | 6,689,220 |
| Events in quadrant B | 51,409,796 | 6,204,727 |
| Events in quadrant C | 20,491,059 | 6,462,968 |
| Events in quadrant D | 33,829,195 | 6,156,897 |
| Mode SS | |||
|---|---|---|---|
| Quadrant | BADHDUFLAG | Total packets | Discarded packets |
| A | 0 | 1718 | 0 |
| B | 0 | 1714 | 0 |
| C | 0 | 1716 | 0 |
| D | 0 | 1714 | 0 |
| Mode M0 | |||
|---|---|---|---|
| Quadrant | BADHDUFLAG | Total packets | Discarded packets |
| A | 0 | 182036 | 0 |
| B | 0 | 308972 | 0 |
| C | 0 | 187398 | 0 |
| D | 0 | 226672 | 0 |
| Mode M9 | |||
|---|---|---|---|
| Quadrant | BADHDUFLAG | Total packets | Discarded packets |
| A | 0 | 149 | 0 |
| B | 0 | 149 | 0 |
| C | 0 | 150 | 0 |
| D | 0 | 150 | 0 |
| Quadrant | Total seconds | Saturated seconds | Saturation percentage |
|---|---|---|---|
| A | 84505 | 1424 | 1.685107% |
| B | 84392 | 11817 | 14.002512% |
| C | 84556 | 2570 | 3.039406% |
| D | 84545 | 3396 | 4.016796% |
Noise dominated data is calculated using 1-second bins in cleaned event files. If a bin has >2000 counts, and if more than 50% of those come from <1% of pixels, then it is considered to be noise-dominated and hence unusable.
| Quadrant | # 1 sec bins | Bins with >0 counts | Bins with >2000 counts | High rate bins dominated by noise | Noise dominated (total time) | Noise dominated (detector-on time) | Marked lightcurve |
|---|---|---|---|---|---|---|---|
| A | 112012 | 84651 | 45 | 45 | 0.04% | 0.05% |  |
| B | 112012 | 84447 | 1881 | 1881 | 1.68% | 2.23% |  |
| C | 112012 | 84707 | 68 | 68 | 0.06% | 0.08% |  |
| D | 112012 | 84681 | 754 | 754 | 0.67% | 0.89% |  |
Top three noisy pixels from each quadrant. If the there are fewer than three noisy pixels in the level2.evt file, extra rows are filled as -1
| Pixel properties | Quadrant properties | ||||||
|---|---|---|---|---|---|---|---|
| Quadrant | DetID | PixID | Counts | Sigma | Mean | Median | Sigma |
| A | 0 | 13 | 2121282 | 2147.7 | 4589 | 4514 | 985.6 |
| A | 13 | 254 | 141249 | 138.73 | 4589 | 4514 | 985.6 |
| A | 0 | 226 | 29258 | 25.11 | 4589 | 4514 | 985.6 |
| B | 6 | 159 | 20638660 | 25426.54 | 4278 | 4175 | 811.5 |
| B | 12 | 1 | 12410287 | 15287.25 | 4278 | 4175 | 811.5 |
| B | 4 | 80 | 517036 | 631.97 | 4278 | 4175 | 811.5 |
| C | 0 | 10 | 1636956 | 1567.36 | 4415 | 4399 | 1041.6 |
| C | 3 | 233 | 1235282 | 1181.73 | 4415 | 4399 | 1041.6 |
| C | 10 | 22 | 211983 | 199.29 | 4415 | 4399 | 1041.6 |
| D | 8 | 195 | 10751486 | 10586.73 | 4433 | 4287 | 1015.2 |
| D | 12 | 218 | 2822186 | 2775.82 | 4433 | 4287 | 1015.2 |
| D | 13 | 249 | 1033008 | 1013.36 | 4433 | 4287 | 1015.2 |
Histogram calculated using DETX and DETY for each event in the final _common_clean file
| Quadrant A |  |
 |
Quadrant B |
|---|---|---|---|
| Quadrant D |  |
 |
Quadrant C |
| Plot type | Count rate plots | Images |
|---|---|---|
| Comparison with Poisson distribution Blue bars denote a histogram of data divided into 1 sec bins. Red curve is a Poisson curve with rate = median count rate of data. |
 |
 |
| Quadrant-wise count rates Data is divided into 100 sec bins |
 |
|
| Module-wise count rates for Quadrant A Data is divided into 100 sec bins |
 |
 |
| Module-wise count rates for Quadrant B Data is divided into 100 sec bins |
 |
 |
| Module-wise count rates for Quadrant C Data is divided into 100 sec bins |
 |
 |
| Module-wise count rates for Quadrant D Data is divided into 100 sec bins |
 |
 |
| Parameter | Plot |
|---|---|
| CZT HV Monitor |  |
| D_VDD |  |
| Temperature 1 | 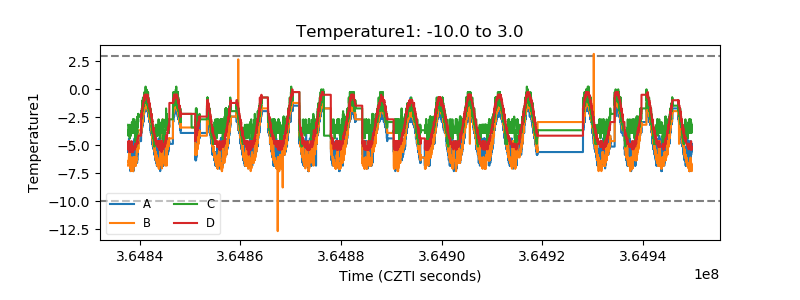 |
| Veto HV Monitor | 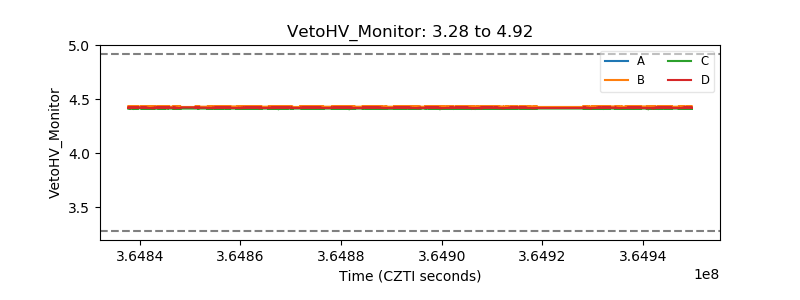 |
| Veto LLD |  |
| Alpha Counter |  |
| _CPM_Rate |  |
| CZT Counter |  |
| +2.5 Volts monitor | 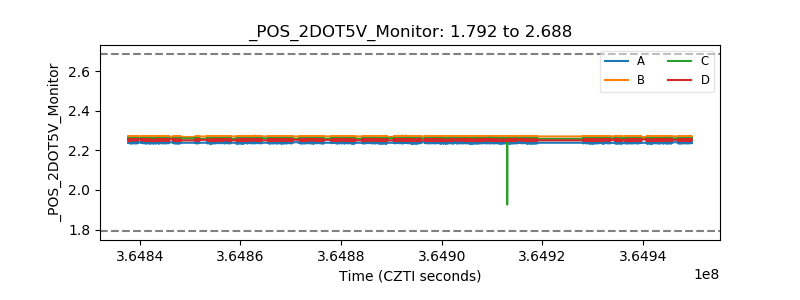 |
| +5 Volts monitor |  |
| _ROLL_ROT |  |
| _Roll_DEC |  |
| _Roll_RA |  |
| Veto Counter |  |